• Render price is on a steep load-shedding exercise after a rejection from the late December highs.
  • RNDR could extend the fall by 13% to the 61.8% Fibonacci retracement if the 50-day SMA at $4.26 fails to hold.
  • A higher high above $5.28 would invalidate the bearish thesis.
  • The Nosana Compute Client onboarding voting ends on February 6.

Render (RNDR) price has displayed massive volatility over the past few weeks, coming on the back of a choppy altcoin market. Over the last day, however, the altcoin has taken to a steep load-shedding exercise that could see RNDR holders suffer grave losses if the immediate support gives in.

Also Read: Render Price Prediction: RNDR bulls prepare to revisit $5.27

Render’s Nosana Compute Client onboarding voting conclusion

Render (RNDR) price has plummeted 8% ahead of the conclusion of the Nosana Compute Client onboarding voting. The event is part of a proposal to onboard Nosana as Render’s fourth compute client. This includes a 30,000 RENDER token grant that passed the initial vote, with the final vote due to end on February 6.

Nosana is a DePIN built atop the Solana blockchain, helping developers and organizations build out and launch AI inference models. Nosana specifically caters to developers of AI inference models and applications. This defines its unique market compared to the other compute clients on the Render Network.

Render price outlook

Render (RNDR) price is on a downtrend, down nearly 10% in the last day. If the 50-day Simple Moving Average (SMA) gives way, the token could roll over to the 61.8% Fibonacci level of $3.75. This would denote a 13% fall below current levels.

In a dire case, the slump could see Render price extend a leg lower to the 50% Fibonacci level at $3.27. A break and close below this level would invalidate the prevailing big-picture bullish outlook.

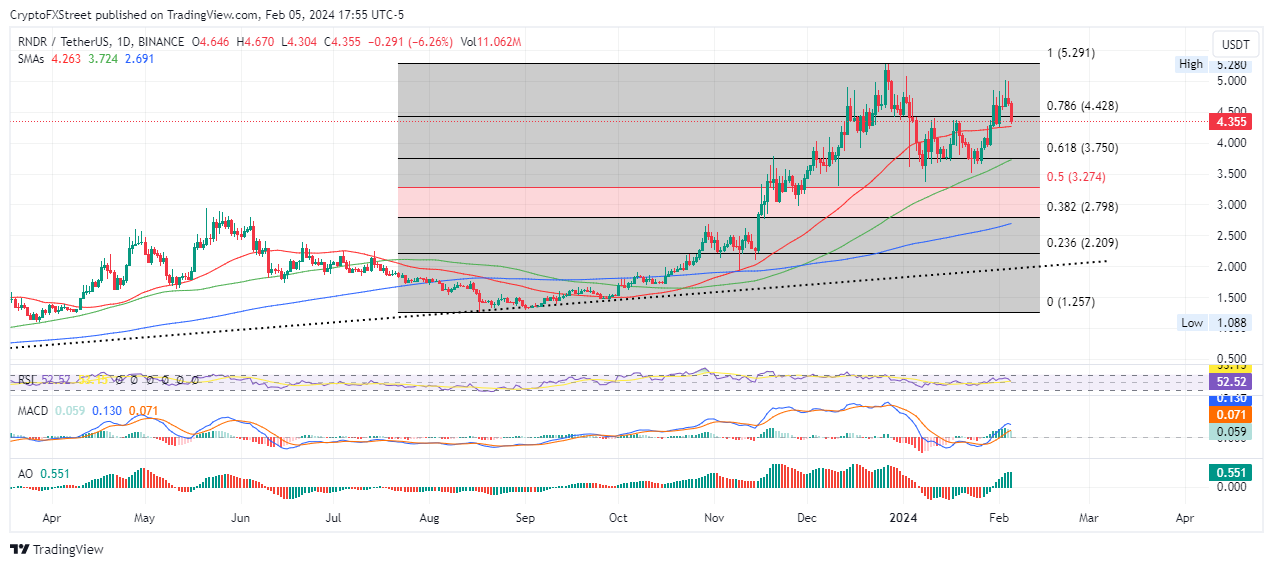
RNDR/USDT 1-day chart

Meanwhile, the Render price sits on the support due to the 50-day Simple Moving Average (SMA) at $4.26. Despite an 8% dip on the day, the odds continue to favor the bulls. This is seen by the position of the Relative Strength Index (RSI) above 50 and the Moving Average Convergence Divergence (MACD) above its signal line (orange band).

Also, the histogram bars of both the MACD and the Awesome Oscillator show large volumes of green histogram bars, adding credence to the bullish thesis.

If the bulls increase their buyer momentum, Render price could pivot around the 50-day SMA, scaling a move north. This could see the cryptocurrency extend to tag $5.27, and even reclaiming the range high at $5.28. A higher high above $5.28 would invalidate the bearish thesis. Such a move would denote a 20% climb above current levels.


Information on these pages contains forward-looking statements that involve risks and uncertainties. Markets and instruments profiled on this page are for informational purposes only and should not in any way come across as a recommendation to buy or sell in these assets. You should do your own thorough research before making any investment decisions. FXStreet does not in any way guarantee that this information is free from mistakes, errors, or material misstatements. It also does not guarantee that this information is of a timely nature. Investing in Open Markets involves a great deal of risk, including the loss of all or a portion of your investment, as well as emotional distress. All risks, losses and costs associated with investing, including total loss of principal, are your responsibility. The views and opinions expressed in this article are those of the authors and do not necessarily reflect the official policy or position of FXStreet nor its advertisers. The author will not be held responsible for information that is found at the end of links posted on this page.

If not otherwise explicitly mentioned in the body of the article, at the time of writing, the author has no position in any stock mentioned in this article and no business relationship with any company mentioned. The author has not received compensation for writing this article, other than from FXStreet.

FXStreet and the author do not provide personalized recommendations. The author makes no representations as to the accuracy, completeness, or suitability of this information. FXStreet and the author will not be liable for any errors, omissions or any losses, injuries or damages arising from this information and its display or use. Errors and omissions excepted.

The author and FXStreet are not registered investment advisors and nothing in this article is intended to be investment advice.

Join Telegram

Recommended content


Recommended Content

Editors’ Picks

Could Worldcoin price shoot up 45% ahead of OpenAI’s live stream on Monday?

Could Worldcoin price shoot up 45% ahead of OpenAI’s live stream on Monday?

Worldcoin has formed a double bottom around a key support level, suggesting a potential accumulation. If the OpenAI’s Monday live stream has a positive impact on Artificial Intelligence field, it could positively impact WLD and other AI-based tokens. 

More Worldcoin News

Here’s what needs to happen for The Graph price to revisit $0.422

Here’s what needs to happen for The Graph price to revisit $0.422

The Graph price trades inside the $0.192 to $0.494 range. Investors need to wait for GRT to overcome $0.343 before being bullish on GRT. If successful, GRT could rally 50% and revisit the $0.422 hurdle. A decisive daily candlestick close below $0.192 will invalidate the bullish thesis.

More The Graph News

SingularityNET price could bounce 30% if AGIX can hold this level

SingularityNET price could bounce 30% if AGIX can hold this level

SingularityNET price has been consolidating around the bottom of the $0.903 to $1.475 range for nearly a month. With some AI-tokens showing signs of revival, AGIX needs to be enalyzed for potential breakout opportunities like Arkham (ARKM).

More SingularityNET News

Arkham price primed for a recovery rally ahead of OpenAI’s announcement

Arkham price primed for a recovery rally ahead of OpenAI’s announcement

Arkham price eyes a potential reversal as it clears key hurdles. ARKM likely to rally 27% if it can overcome $2.74 resistance level. A breakdown of $2.28 wil invalidate the bullish thesis for the AI-based token.

More Arkham News

Bitcoin: Why BTC is close to a bottom

Bitcoin: Why BTC is close to a bottom

Bitcoin (BTC) price efforts of a recovery this week have been countered by selling pressure during the onset of the American session. However, the downside potential appears to have been capped. 

Read full analysis

BTC

ETH

XRP