Polygon price action drops as death cross scares investors away
- Polygon price action has red lights flashing as a potential death cross lurks.
- MATIC bulls see their efforts cut short for a fifth consecutive week of losses.
- With a third rejection against the red descending trend line, the price target looks to be set at $1.246 or $1.097 short-term.

Polygon (MATIC) price action is set to close out the week with another red candle, the fifth already in a row. MATIC has many technical elements against it from making any upward moves, even without talking about geopolitics or the dollar strength. With this fifth negative close in a row, the 55-day Simple Moving Average (SMA) is moving below the 200-day SMA, performing the dreaded death cross that will scare investors away for a long time. Expect to see continuous descending price pressure until a significant positive catalyst can change the tide, but for now, more downturns will come.
MATIC joins the club of cryptocurrencies carrying a death cross
Polygon price action was one of the most promising cryptocurrencies, holding good cards against some other cryptocurrencies and was ready to book massive gains at the start of 2022. But into the third month of this year, that sentiment has completely evaporated, and it looks hard to find bulls and investors wanting to engage in a longer-term trade. Expect this current negativeness to hang over MATIC as the death cross will weigh on sentiment and not attract any investors soon.
MATIC price action got rejected this week against the red descending trend line, showing that the red trend line is confirmed and needs to be considered going forward. Expect price action now to trade lower in search of support, which could come from the low of February at $1.246. If dollar strength and more negative headlines keep persisting, expect to see a break lower towards $1.097 with the pivotal historical level to hold some importance and slow down the downtrend as investors await further developments out of Russia and Ukraine.
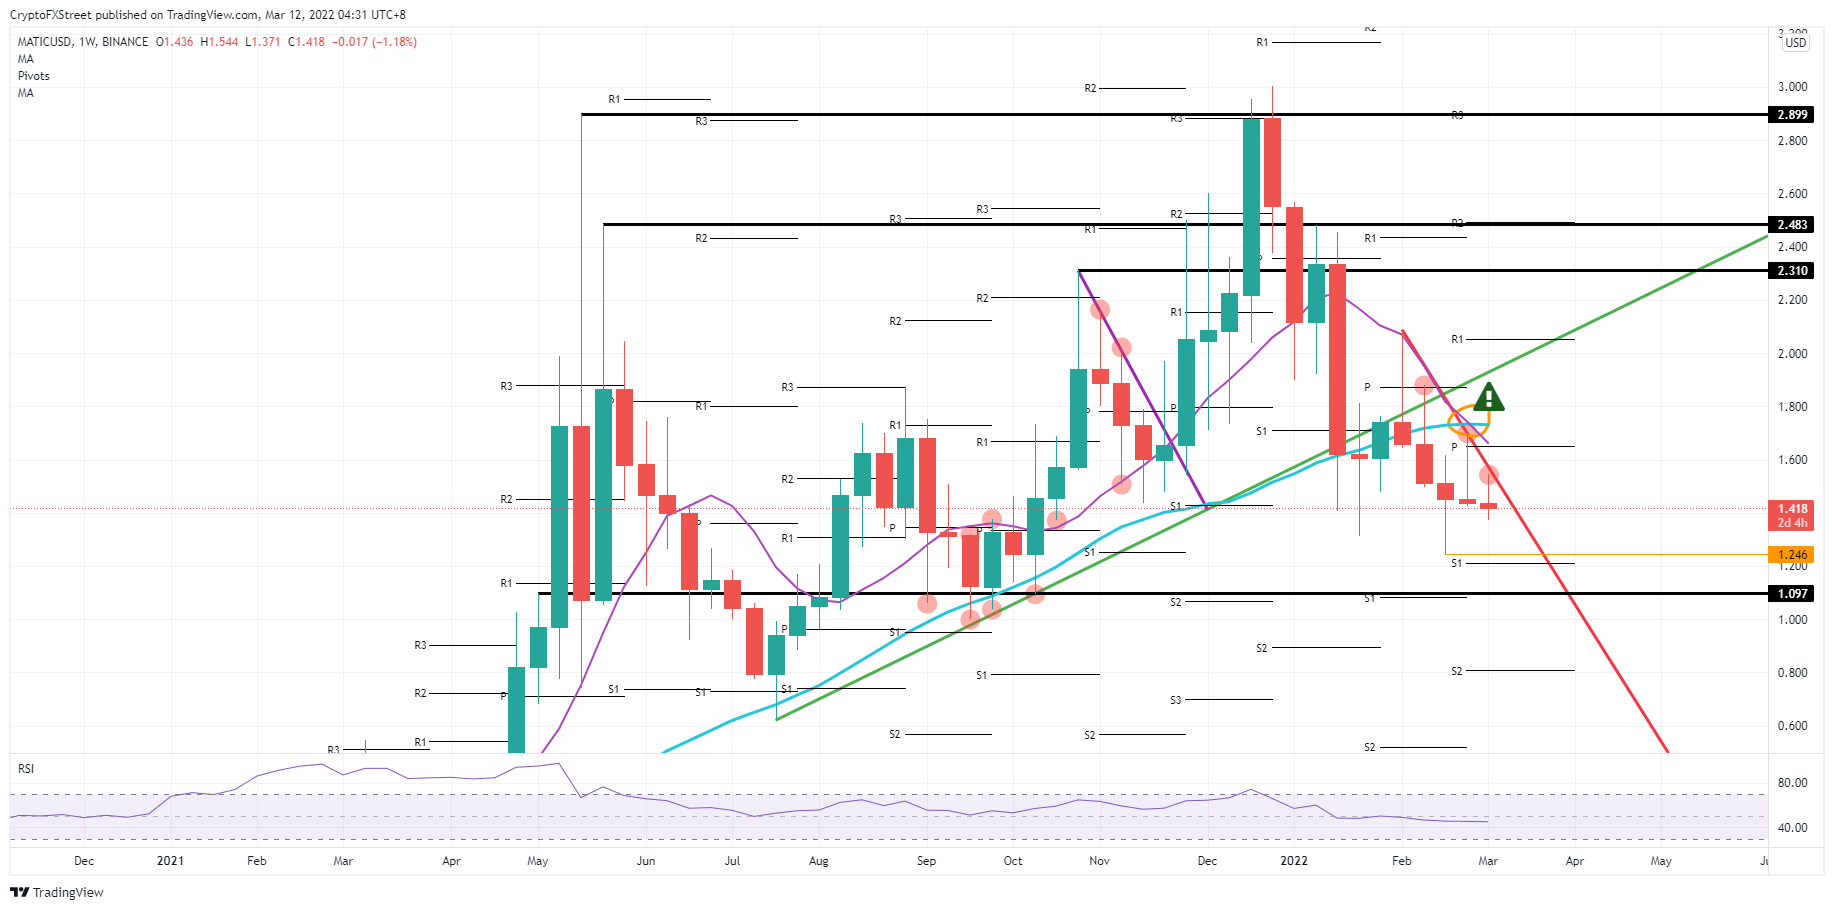
MATIC/USD weekly chart
Luckily there is still a wait of all this, as a significant catalyst would be enough to trigger a breakout trade in the first phase, with a sharp and large rally to the upside, and in this process, undoing the death cross that is currently dictating sentiment in MATIC price action. That catalyst could come from a global coordinated central bank action to support the economy or peace talks that provide some relief and soften the situation in Ukraine. Expect once that happens, to see a break above the red descending trendline, triggering a massive inflow of investors that will rally price up to the green ascending trend line near $2.000, and in the move tilt the 55-day SMA back above the 200-day SMA.
Author

Filip Lagaart
FXStreet
Filip Lagaart is a former sales/trader with over 15 years of financial markets expertise under its belt.


