• MATIC price action shows further upside potential after a few bullish signals popped up.
  • The token broke past previous resistance levels and could challenge the weekly high at $1.70
  • It is worth noting that a dip below $1.44 can invalidate the bullish thesis.

MATIC price rallied after printing a Morning Star candlestick on its daily chart. If bulls can maintain the upward momentum, then $1.60 and $1.65 can be seen as the next targets for Polygon’s native token.

MATIC price rally is within arms reach

MATIC price has regained significant ground as bulls appear to be pushing the pedal on the daily chart. The strength in buying power is also validated by the Relative Strength Index, which bottomed perfectly at the 40 levels. 

The next step for the MATIC price is to flip this week's supply zone into support, which lies between $1.45 and $1.50. If MATIC price can consolidate above this resistance barrier, then Polygon’s native token should have no problem in challenging bears between $1.60 and $1.65 and even the weekly high at $1.70.

MATIC price chart

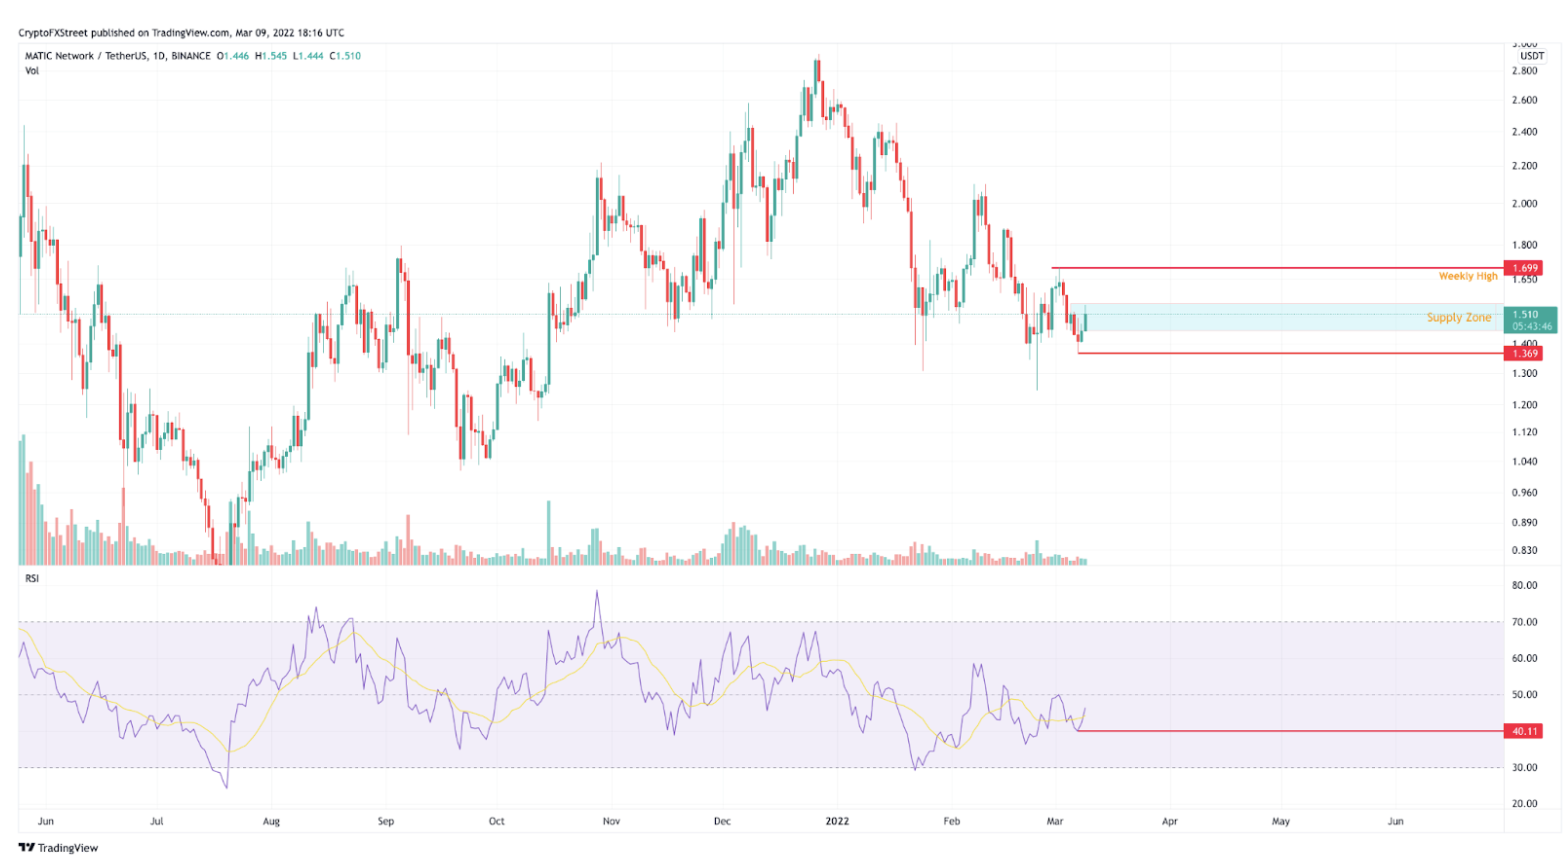
MATIC/USD 1-day chart

Even though MATIC price appears to favor the bulls, there is still a chance that bears can take over once again. If MATIC price cannot print a daily close above the weekly supply zone, then it will spell trouble gaining appeal from new capital.  

Failing to break out and retest this week's supply zone could indicate that MATIC’s recent price action is part of a short-term Sucker's Rally. A test of today's opening price at $1.44 will be the first bearish signal to invalidate the overall bullish thesis. If this happens, MATIC price will likely dive towards the swing low at $1.37 and even attempt to grab liquidity under $1.24, representing a 17% correction from the current levels.


Information on these pages contains forward-looking statements that involve risks and uncertainties. Markets and instruments profiled on this page are for informational purposes only and should not in any way come across as a recommendation to buy or sell in these assets. You should do your own thorough research before making any investment decisions. FXStreet does not in any way guarantee that this information is free from mistakes, errors, or material misstatements. It also does not guarantee that this information is of a timely nature. Investing in Open Markets involves a great deal of risk, including the loss of all or a portion of your investment, as well as emotional distress. All risks, losses and costs associated with investing, including total loss of principal, are your responsibility. The views and opinions expressed in this article are those of the authors and do not necessarily reflect the official policy or position of FXStreet nor its advertisers. The author will not be held responsible for information that is found at the end of links posted on this page.

If not otherwise explicitly mentioned in the body of the article, at the time of writing, the author has no position in any stock mentioned in this article and no business relationship with any company mentioned. The author has not received compensation for writing this article, other than from FXStreet.

FXStreet and the author do not provide personalized recommendations. The author makes no representations as to the accuracy, completeness, or suitability of this information. FXStreet and the author will not be liable for any errors, omissions or any losses, injuries or damages arising from this information and its display or use. Errors and omissions excepted.

The author and FXStreet are not registered investment advisors and nothing in this article is intended to be investment advice.

Recommended content


Recommended Content

Editors’ Picks

Pi Network Price Forecast: A Possible bullish pattern breakout in PI teases trend reversal

Pi Network Price Forecast: A Possible bullish pattern breakout in PI teases trend reversal

Pi Network edges higher at press time on Thursday as it trades in the green for the third consecutive day. The recovery could have been driven by the launch of the new Pi Node version, while the technical outlook shares the possibility of extended gains with a bullish pattern breakout. 

Sui Price Forecast: Technical breakout aims for $4.00, supported by TVL growth

Sui Price Forecast: Technical breakout aims for $4.00, supported by TVL growth

Sui extends its breakout above the descending channel and reclaims the 100-day EMA at $3.07 as support. Sui’s DeFi Total Value Locked nears the $2 billion mark, indicating rising investor confidence.

Bitcoin eyes $120,000 as prospects of Fed rate cuts fuel market optimism

Bitcoin eyes $120,000 as prospects of Fed rate cuts fuel market optimism

Bitcoin price stabilizes around 111,000 on Thursday after hitting a record high of nearly $112,000 the previous day. Fed Minutes spark renewed risk-on sentiment as it showed officials foresee interest rate cuts later this year, boosting momentum across markets.

Crypto Today: Bitcoin's new all-time high reignites risk-on sentiment as Ethereum, XRP bulls increase exposure

Crypto Today: Bitcoin's new all-time high reignites risk-on sentiment as Ethereum, XRP bulls increase exposure

Bitcoin could extend its price discovery phase amid renewed risk-on sentiment following its new record high. Ethereum extends gains toward $2,880 critical resistance on the backdrop of rising spot ETF inflows.

Bitcoin: BTC ends Q2 with 30% gains, Standard Chartered eyes $200K by year-end

Bitcoin: BTC ends Q2 with 30% gains, Standard Chartered eyes $200K by year-end

Bitcoin (BTC) closed a strong second quarter (Q2), recording nearly 30% in quarterly gains amid rising corporate and institutional demand and bullish market sentiment.

The Best brokers to trade EUR/USD

The Best brokers to trade EUR/USD

SPONSORED Discover the top brokers for trading EUR/USD in 2025. Our list features brokers with competitive spreads, fast execution, and powerful platforms. Whether you're a beginner or an expert, find the right partner to navigate the dynamic Forex market.

BTC

ETH

XRP