Polkadot Price Prediction: DOT could slide another 25% due to a bearish confirmation
- Polkadot price confirmed a bearish breakout from an ascending triangle pattern on March 15.
- DOT has dropped 7% since it sliced through the triangle’s hypotenuse and could corect another 25%.
- This pullback could be cut short if bulls come to the rescue around the 200 six-hour moving average (MA) at $28.6.

Polkadot price is overrun by sellers who could drag the altcoin down by 20%. However, the downtrend could reverse mid-way due to a stiff demand barrier.
Polkadot price hints more downtrend
Polkadot price hit a blockade around the $38.5 level, which has prevented four impulse waves from creating a higher high. Nonetheless, aggressive buying activity has resulted in DOT forming higher lows after every rejection at the flat horizontal resistance barrier at $38.5.
Drawing trendlines along the equal highs aka the flat supply barrier, and the swing lows form an ascending triangle pattern. This technical formation forecasts a 30% downswing, determined by measuring the distance between the pivot high and pivot low and adding it to the breakout point. This target places DOT at $24.4.
Polkadot price confirmed a bearish breakout as it sliced through the triangle’s hypotenuse on March 15. Since then, the DeFi coin has dropped nearly 7% and shows signs of reaching its target, which is another 25% sell-off.
It is worth noting that DOT’s descent could be cut short due to the presence of 200 six-hour MA around $28.6. Interestingly, this barrier coincides with the 50% Fibonacci retracement level.
So, investors should note two levels of interest, $28.6 and the intended target of $24.4.
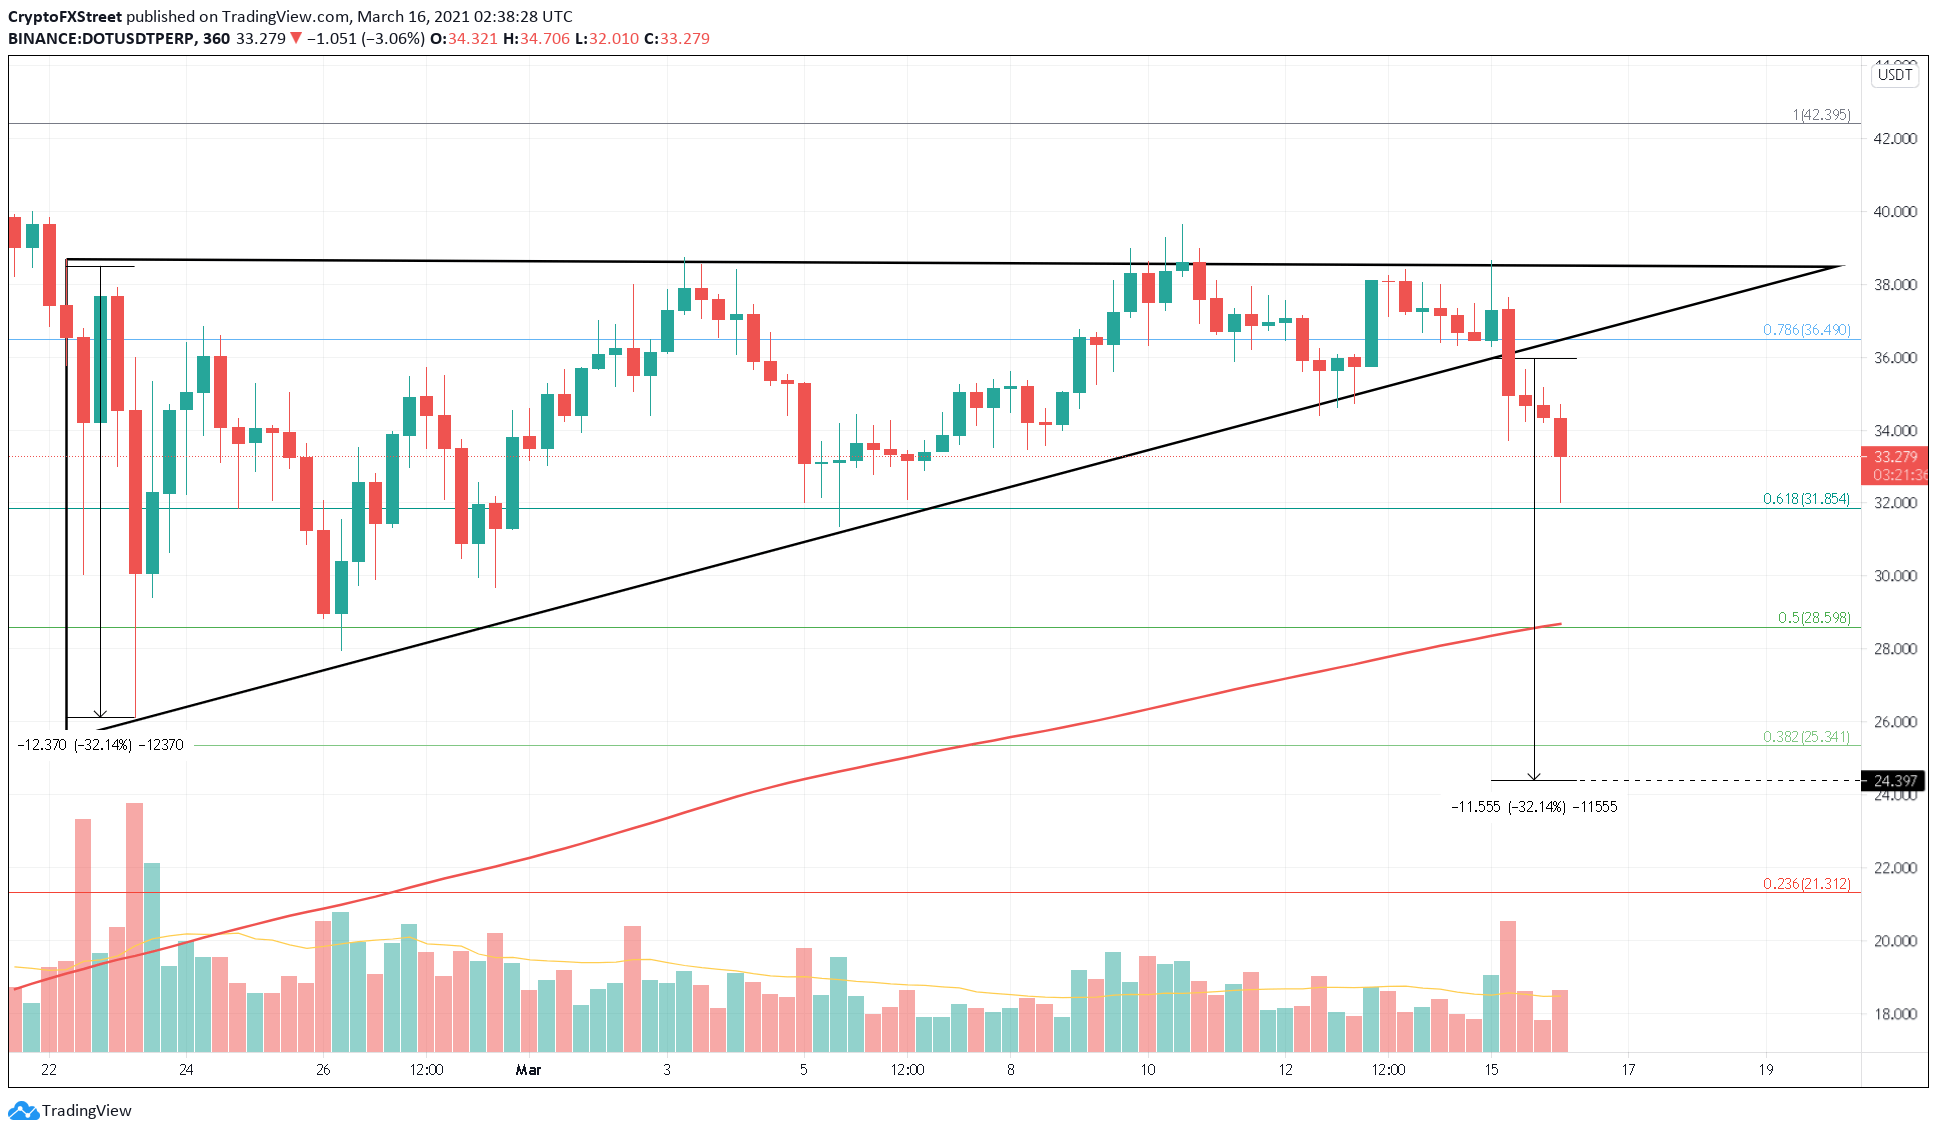
DOT/USDT 6-hour chart
Ascending triangles are inherently bullish and are continuation patterns. So, the bearishness seen around Polkadot price could be temporary and even a fakeout. In such a case, a six-hour candlestick close above $39.1 will confirm a higher high and even propel DOT to its previous all-time high at $42.4.
A spike in buying pressure here could continue its ascent up to the 127.2% Fibonacci retracement level at $50.
Author

Akash Girimath
FXStreet
Akash Girimath is a Mechanical Engineer interested in the chaos of the financial markets. Trying to make sense of this convoluted yet fascinating space, he switched his engineering job to become a crypto reporter and analyst.



