Polkadot Price Analysis: DOT tumbles from $40 amid multiple sell signals
- Polkadot has been rejected from $40 as overhead pressure mounts.
- The TD Sequential indicator flashed a sell signal in addition to the MACD flipping bearish.
- Support at the 50 SMA, highlighted at $35, could call for stability and recovery back to $40.

Polkadot had sustained the uptrend after the recent support at $32.25. Although the uptrend targeted new record highs, DOT failed to break above the hurdle at $40. A correction is ongoing amid rising selling pressure.
Polkadot on the verge of a massive breakdown
DOT is exchanging hands at $36.7 following the rejection from $40. The mission is to secure higher support. Meanwhile, the 50 Simple Moving Average (SMA) at $35 is the immediate support. If Polkadot slices through this zone, many sell orders will trigger, adding to the current selling pressure.
The 100 SMA currently holds the ground at $34.5 but does not seem robust enough to stop the losses. Therefore, closing the day under the 50 SMA may see the bearish leg extend to the primary support at the 200 SMA.
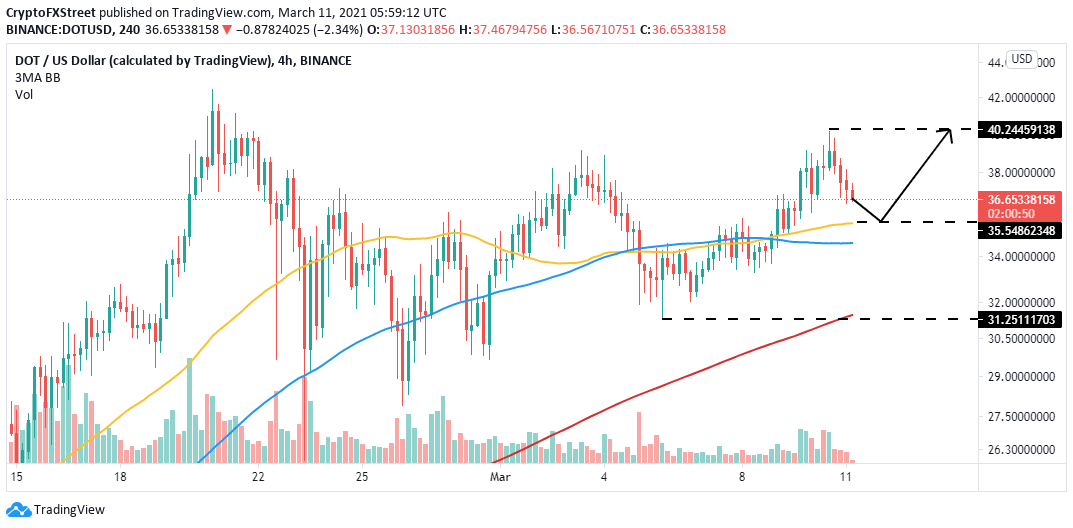
DOT/USD 4-hour chart
The TD Sequential indicator has recently presented a sell signal on the 4-hour chart. The signal manifested in a green nine candlestick. The sell signal implies that the uptrend is getting exhausted while bears are ready to take over control. Most of the sell signals flashed for Polkadot tend to be validated; thus, the breakdown may continue to dominate.
A comprehensive look at the same chart shows that the Moving Average Convergence Divergence has confirmed the bearish outlook. The MACD has stalled and is on the verge of a move back to the mean line. Besides, the MACD cross under the signal line hints at the correction lasting longer.
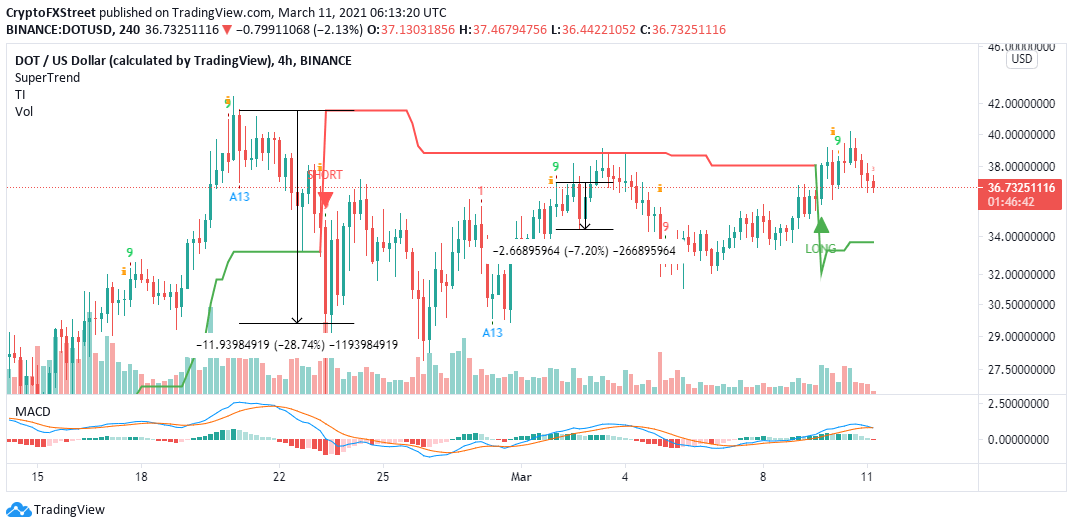
DOT/USD 4-hour chart
Looking at the other side of the fence
Two days ago, the SuperTrend indicator gave traders a signal to take a long position on DOT. This means that Polkadot may dwell in a generally up-trending market in the short-term. Similarly, holding above the 50 SMA could cut short the breakdown and lead to recovery above $40.
Author

John Isige
FXStreet
John Isige is a seasoned cryptocurrency journalist and markets analyst committed to delivering high-quality, actionable insights tailored to traders, investors, and crypto enthusiasts. He enjoys deep dives into emerging Web3 tren


