Polkadot Price Forecast: DOT must reclaim key level for a chance to see new all-time highs
- Polkadot price is contained inside a symmetrical triangle pattern on the 4-hour chart.
- The digital asset faces a key resistance level which could be the key to new all-time highs.
- Investors are interested in Polkadot as a potential alternative to Ethereum in the long-term.

Polkadot has been under consolidation since February 20 when it established its new all-time high at $42.2. The digital asset has been trading inside a tightening range and awaits a clear breakout or breakdown.
Polkadot price has the potential to establish new all-time highs above $50
On the 4-hour chart, a symmetrical triangle pattern formed in the past two weeks will be decisive for the future of Polkadot. Bulls need to push DOT above a key resistance level at $34.3 which coincides with the 50-SMA and the 100-SMA levels.
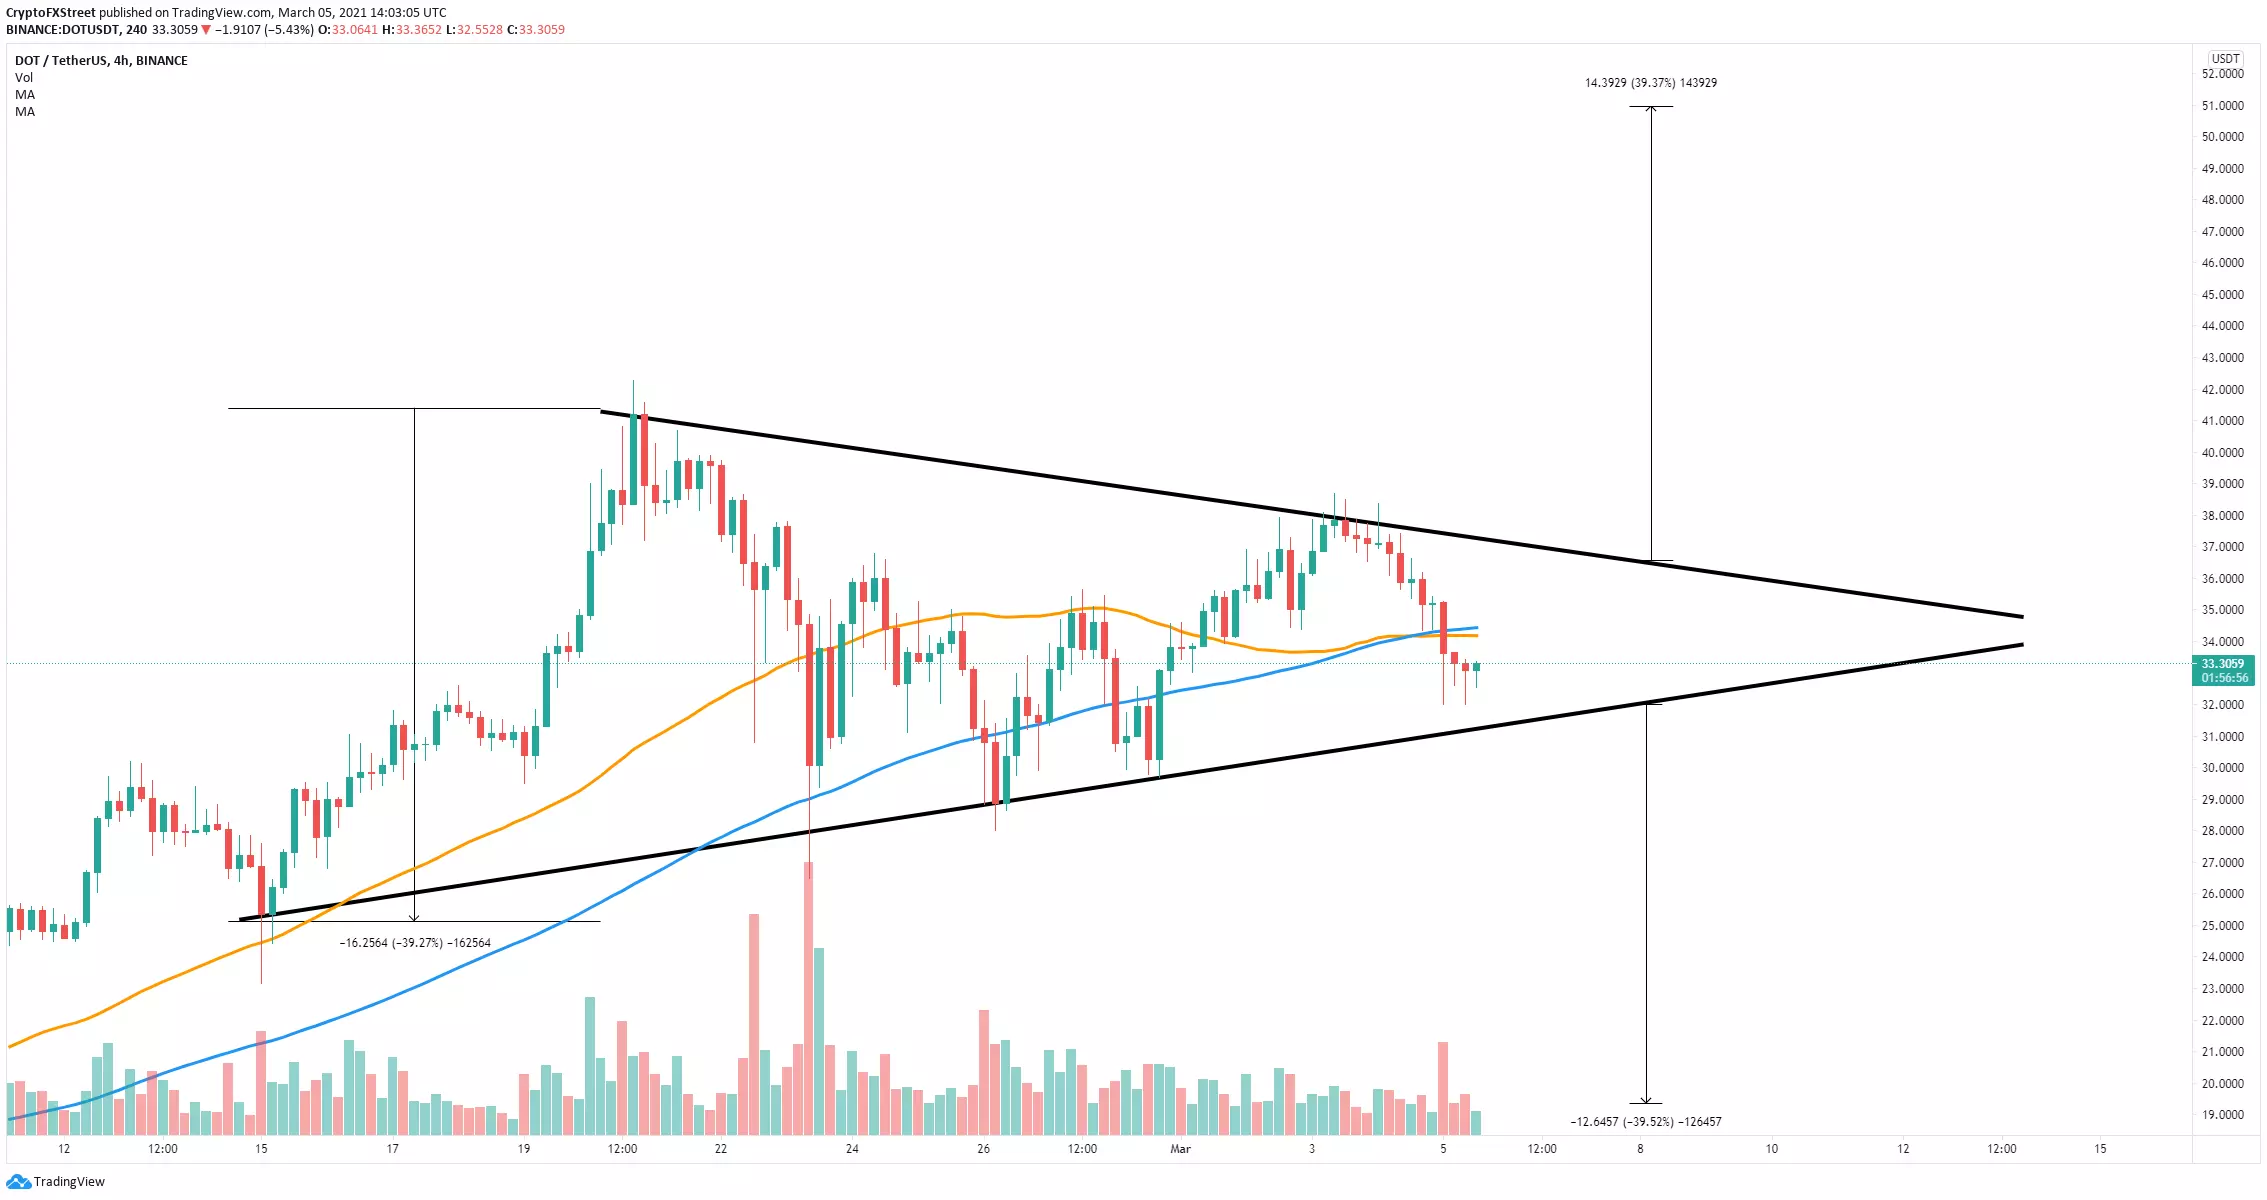
DOT/USD 4-hour chart
Reclaiming this key level will quickly drive Polkadot price towards the upper trendline of the pattern at $36.6. A breakout above this point would have a price target of $51 in the long-term, calculated using the maximum height of the pattern.
Earlier today, Polkadot also announced a partnership with IOST to bring cross-chain interoperability to the masses. This new alliance will allow users to transact across all blockchains supported by Polkadot in the future. The most significant development in the past week has been the integration of Polkadot into Ledger.
Ledger Live has integrated Polkadot!
— Polkadot (@Polkadot) March 4, 2021
This integration means users can get the security benefits of keeping their secret key secured on a @Ledger device while also being able to manage their accounts and perform staking activity all in one convenient app.https://t.co/kjfKUCKiJd
On the other hand, a rejection from $34.3 will lead to a fall towards the pattern’s lower boundary at around $32. A breakdown below this critical point should push Polkadot price below $20, another 40% move.
Author

Lorenzo Stroe
Independent Analyst
Lorenzo is an experienced Technical Analyst and Content Writer who has been working in the cryptocurrency industry since 2012. He also has a passion for trading.



