- Polkadot price is contained inside a symmetrical triangle pattern on the 12-hour chart.
- The digital asset is on the verge of a massive 30% move within the next three days.
- According to various indicators, bulls should have the upper hand.
Polkadot has been trading inside a tightening range since February 20 and it’s on the verge of a massive move. Bulls need to hold a key level to potentially see a 30% breakout while bears aim to crack the same point.
Polkadot price targets 30% breakout
On the 12-hour chart, DOT has formed a symmetrical triangle pattern which is on the verge of a massive move. The lower trendline support is located at $33 which coincides with the 50-SMA, making it a robust support level.
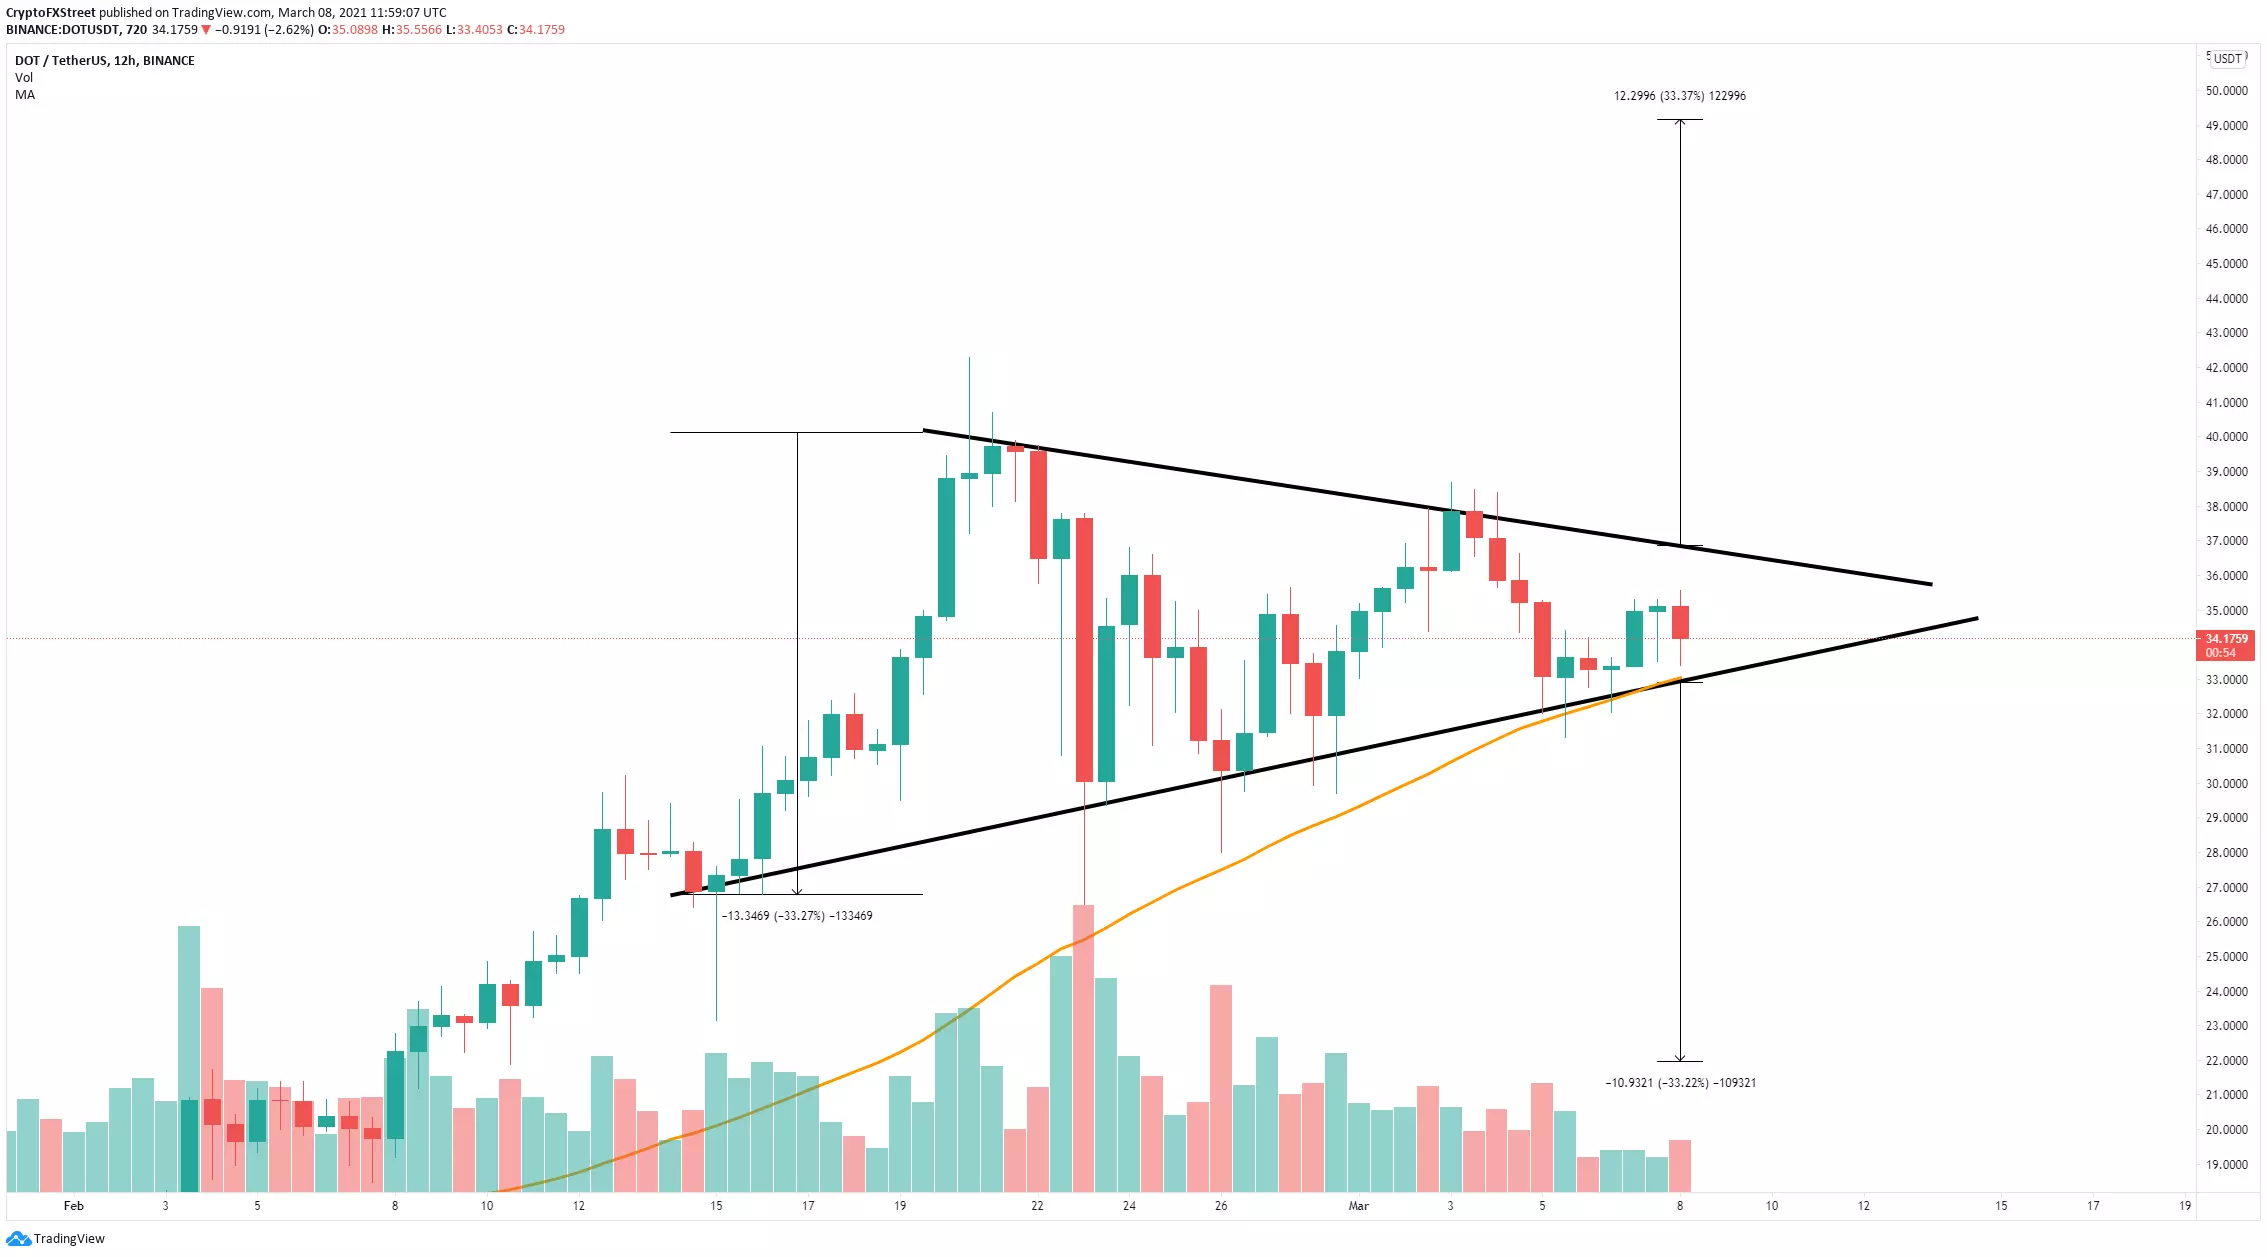
DOT/USD 12-hour chart
A rebound from this key support level should quickly push Polkadot price towards the upper boundary. A breakout above this point is critical and will drive DOT towards $50 in the long-term.
On the other hand, losing the key support level at $33 will drive Polkadot price towards a low of $22, a 33% move calculated using the height of the symmetrical triangle as a reference.
Note: All information on this page is subject to change. The use of this website constitutes acceptance of our user agreement. Please read our privacy policy and legal disclaimer. Opinions expressed at FXstreet.com are those of the individual authors and do not necessarily represent the opinion of FXstreet.com or its management. Risk Disclosure: Trading foreign exchange on margin carries a high level of risk, and may not be suitable for all investors. The high degree of leverage can work against you as well as for you. Before deciding to invest in foreign exchange you should carefully consider your investment objectives, level of experience, and risk appetite. The possibility exists that you could sustain a loss of some or all of your initial investment and therefore you should not invest money that you cannot afford to lose. You should be aware of all the risks associated with foreign exchange trading, and seek advice from an independent financial advisor if you have any doubts.
Recommended Content
Editors’ Picks
Space ID price succumbs to selling pressure with $3.54 million worth of ID tokens unlocked in a cliff event

Space ID (ID) price remains bullish based on the Parabolic SAR price-tracking indicator, which continues to track ID price from below. However, the token is trading at a value that is significantly lower than its rate 24 hours ago, an outcome attributed to its scheduled token unlocks event.
Quant price maintains steady multi-month downtrend but 60% of QNT holders remain above water

Quant (QNT) price is trading with a bearish bias, a steady state that has prevailed for the most part of the year. Despite the downtrend, the majority of QNT token holders remain above water, sitting on unrealized profit.
Optimism receives backlash after decision to split 116 million OP tokens for treasury management

Optimism network recently announced the sale of 116 million OP tokens valued at around $162.4 million in a private sale to seven purchasers for treasury management. While the transaction was not expected to impact OP price, it has provoked backlash from onlookers.
Binance unintentionally causes Ethereum gas fees to soar 1,900% as hundreds of inactive wallets move ETH

With many transfers happening within a thin timeframe, Ethereum gas fees soared 1,900%, moving from 15 to around 300 Gwei. The same was reflected in simple Peer-to-Peer (P2P) transactions, which soared from the conventional 40 cents to around $10, data from Dune analytics shows.
Bitcoin: BTC contemplates crash in September

Bitcoin price remains unfazed by the US CPI announcement on September 13 and continues to move in a range. The weekly chart, however, shows a potential short-term recovery rally that could set the stage for a steep correction.