Polkadot Price Prediction: $4 DOT soon but $2.50 is the discount
- Polkadot price is down by 22% since the start of the month.
- DOT trades at the upper end of a range established in 2020.
- Invalidation of the bearish thesis is a breach above $4.65.

Polkadot price could be setting up for a devastating downswing move in the days to come. A 60% decline stands possible for the Polkadot Network token.
Polkadot price in a bearish stronghold
Polkadot price is currently down 20% on the month as the bears have applied nonstop suppression. On December 25, the DOT price was at the gates of the previous trading range that manifested in 2020.
Polkadot price currently auctions at $4.42. The entry into the 2020 liquidity zone was aided by the help of the 8-day exponential moving average. As the price stair steps south, The volume indicator shows a tapered look after a massive influx of bearish came into the market during the first barrier breach on December 16.
The volume may be suggesting sidelined bulls are still uninterested in the discounted DOT offer. The next bearish target is the liquidity levels between $4 and $2.60. The last time DOT traded at these levels was In December of 2020, before rallying 10X into all-time highs at $54 a year later.
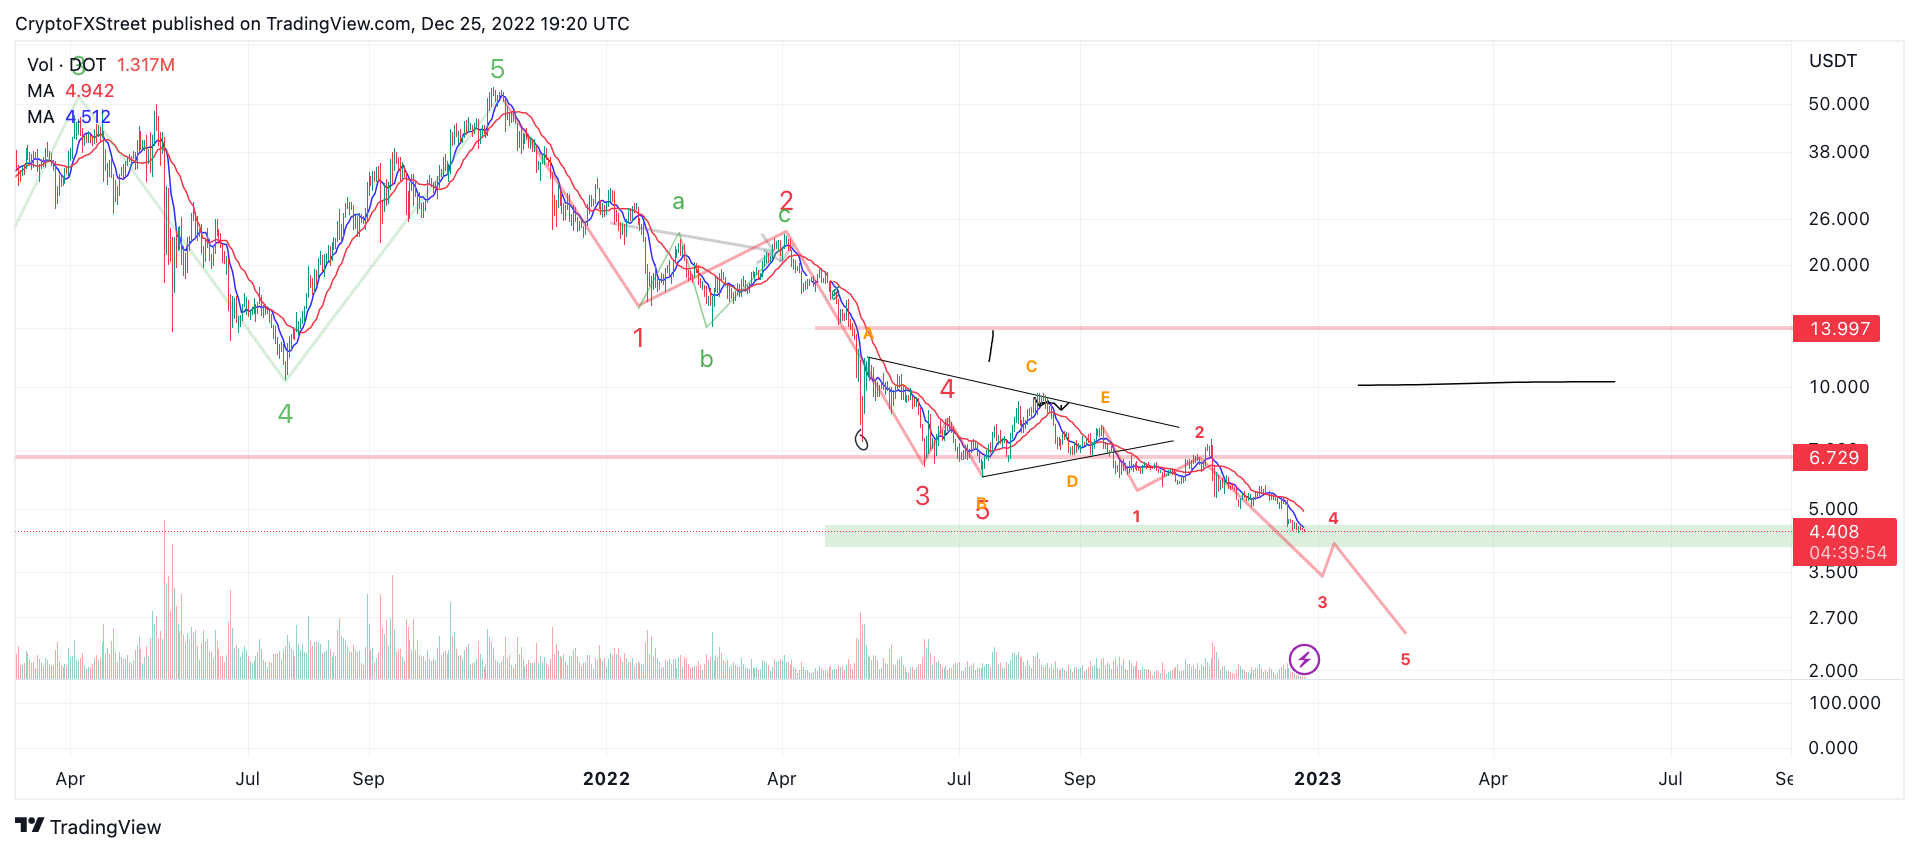
DOT/USDT 1-Day Chart
An early bull mentality should be avoided in the coming days as the technicals show little-to-no evidence to support a countertrend spike. Invalidation of the bearish thesis can occur, but the bulls will need to first hurdle and consolidate above the current range high at $4.65. In doing so, the DOT price could set up a countertrend rally toward the 21-day simple moving average currently positioned at $5. The DOT price would rise by 12% from its current market value if the technicals worked out in the bull's favor.
Author

Tony M.
FXStreet Contributor
Tony Montpeirous began investing in cryptocurrencies in 2017. His trading style incorporates Elliot Wave, Auction Market Theory, Fibonacci and price action as the cornerstone of his technical analysis.


