Polkadot Price Analysis: DOT heads toward all-time high amid broad-based crypto recovery
- Polkadot joins other cryptocurrencies to push for recovery following last week’s losses.
- DOT stepped above the four-hour 50 SMA, paving the way for gains eyeing $40.
- Resistance anticipated at $36, as highlighted by 200 and 100 SMA on the four-hour chart.

Polkadot recently bounced off support at $27 and is moving toward the coveted $40 level. The uptick in the price is not unique to DOT, because other cryptocurrencies have joined the party. Polkadot is doddering at $34 while technical levels gradually improve. The upswing will likely hit highs above $40 in the coming sessions.
Polkadot journey to all-time high begins
Polkadot has made a confirmed break above the 50 Simple Moving Average (SMA) on the four-hour chart. On the upside, the confluence formed by the 100 SMA and the 200 SMA near $36 limits price action at the time of writing. A break above this seller congestion zone would bolster DOT toward $40.
The uptrend has been validated by the Moving Average Convergence Divergence (MACD) indicator on the four-hour chart. This technical tool helps identify the general trend of the market and positions where to buy the dip and sell the top. A MACD line (blue) crossing above the signal line is a bullish signal observed on the four-hour chart.
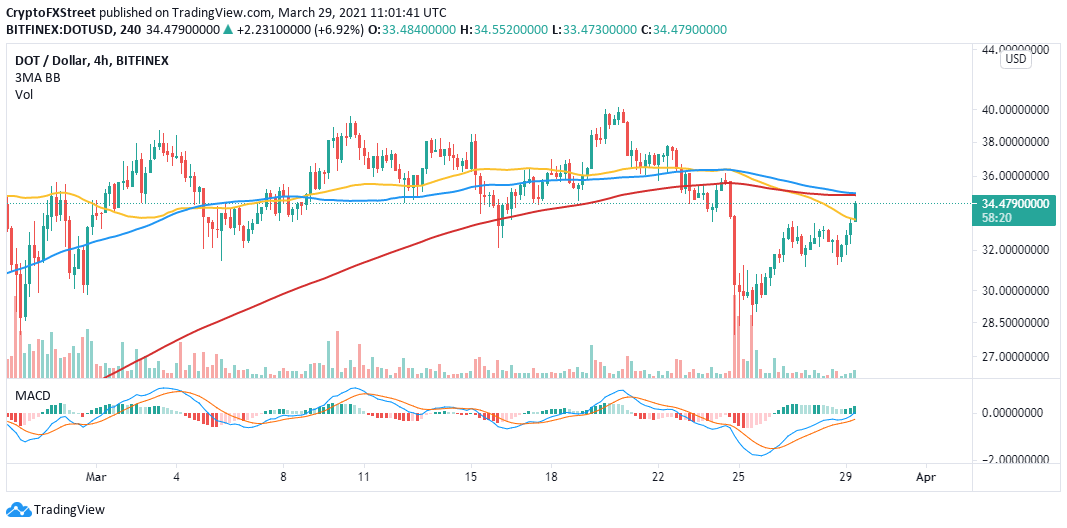
DOT/USD four-hour chart
The four-hour SuperTrend indicator has presented a signal to long Polkadot on the four-hour chart. This tells traders to consider increasing stakes in DOT and speculate on a sustained uptrend in the near term. The SuperTrend indicator tells you to buy when it turns green and flips under the asset’s price.
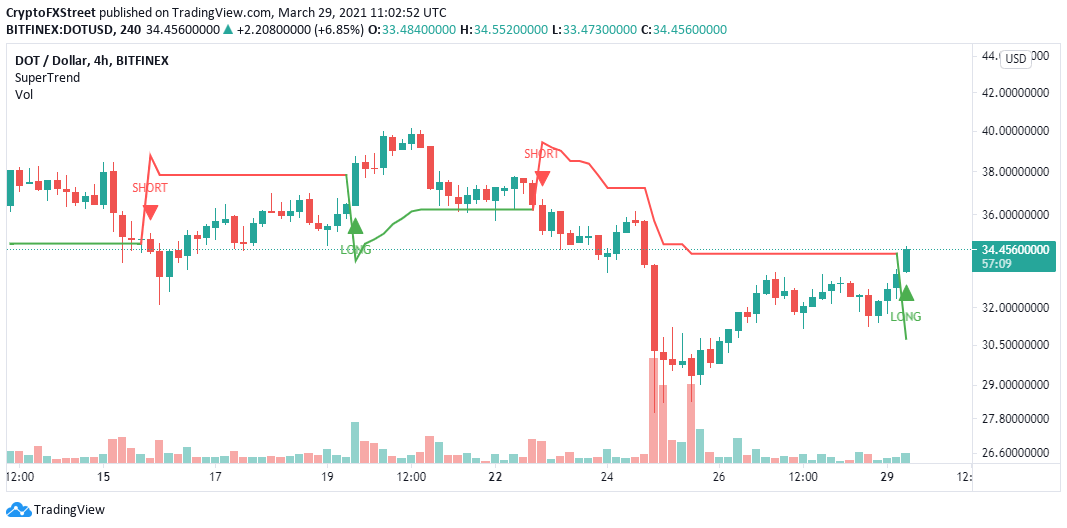
DOT/USD four-hour chart
Looking at the other side of the fence
The confluence formed near $36 by the 100 SMA and the 200 SMA could hinder the price action toward $40. If Polkadot is rejected at this level, losses will be incurred under $30 and seek support at $27. Therefore, holding above the 50 SMA is key to sustaining the uptrend and keeping losses at bay.
Author

John Isige
FXStreet
John Isige is a seasoned cryptocurrency journalist and markets analyst committed to delivering high-quality, actionable insights tailored to traders, investors, and crypto enthusiasts. He enjoys deep dives into emerging Web3 tren


