Polkadot Price Analysis: DOT being dominated by the bears
- Polkadot price is on pace to close with the worst daily decline since September 21, 2020.
- DOT testing 0.382 Fibonacci retracement level at $27.45.
- Daily volume may close above average for the first time since February 28.

Polkadot price is breaking down from a sideways channel on explosive volume. If DOT closes at or near the lows, it will be the worst daily decline since September 21, 2020. It is currently on pace for the 2nd worst weekly loss since trading began in August 2020. This is an abrupt change in the price character that has reigned for the better part of a month.
Polkadot price correction could just be beginning
DOT quickly tested the 0.382 Fibonacci retracement level of the September 2020 crash at $27.45 before mildly rebounding. Today’s low is also just shy of the February low at $26.56, which would represent a decline of $30% from Monday’s high.
If buyers do not enter the market, look for DOT to collapse to the 0.50 retracement level at $22.89 in the coming days, followed by a test of the 100-day simple moving average (SMA) at $21.61.
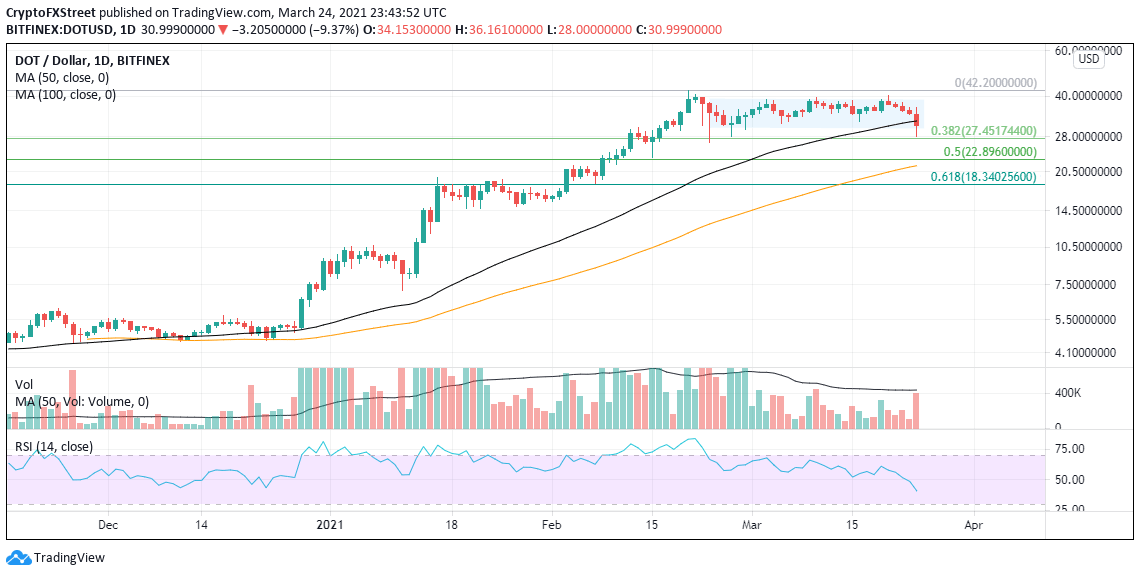
DOT/USD daily chart
To invalidate the emerging bearish outlook, DOT buyers will need to lift the price back into the sideways channel and above the 50-day SMA at $31.14 on a daily close.
A breakout above $40.00 will clear Polkadot price for a test of the all-time at $42.20.
Today’s price action reminds traders about the risks associated with speculating in the cryptocurrency markets and reinforces the value of keeping a big-picture perspective during high volatility events.
Author

Sheldon McIntyre, CMT
Independent Analyst
Sheldon has 24 years of investment experience holding various positions in companies based in the United States and Chile. His core competencies include BRIC and G-10 equity markets, swing and position trading and technical analysis.


