Polkadot price offers a new opportunity for DOT bulls to profit
- Polkadot price has formed a Doji pattern on the daily chart.
- Bollinger Bands continue to contract, reflecting the declining volatility.
- Daily volume has faded as the sideways channel has developed.

Polkadot price contraction since February 24 has put the cryptocurrency on course to trigger a squeeze formation in the next couple of days. Due to the previous robust uptrend, there is a high probability that the channel resolves to the upside.
Polkadot price about to add to the sizeable gains in 2021
Polkadot price is currently trading 17% below the all-time high established on February 20 at $42.20. It is remarkable considering the 40% crash in February after recording the highest Relative Strength Index (RSI) reading at 83.59 since Polkadot began trading.
Now that the extreme overbought condition has been released and the weak holders have been chased from Polkadot, it is time for investors to prepare for a squeeze formation. The upper Bollinger Band is only $0.239 away from closing inside the Keltner Band. A couple more days of tight price action should be enough.
The squeeze direction is never known for sure. Still, considering the long, powerful uptrend, it is a higher probability that DOT price will rally to the upside upon the formation being confirmed. Once the price has cleared the upper Keltner and Bollinger Bands on a daily close, it is open skies for the cryptocurrency to test $42.20, resulting in a 16.8% advance from the current price level.
However, there is far more upside potential for DOT price after clearing the all-time high. The 1.382 Fibonacci extension level at $48.174 and the 1.618 Fibonacci extension level at $51.86 are crucial areas of interest.
It is important to note that investors should initiate a position once the formation has triggered, rather than waiting for a breakout above the bands.
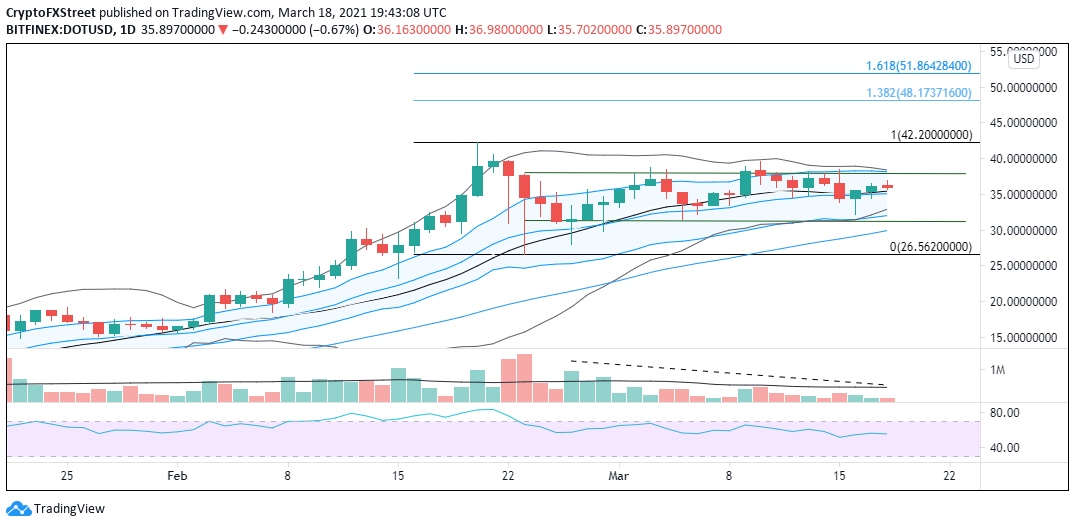
DOT/USD daily chart
If the squeeze formation resolves to the downside, there is significant support at the lower Keltner and Bollinger Bands’ confluence with the lower channel line around $32.00. Additional support surfaces at the 50-day SMA, currently at $21.92, and then the low of the February crash at $26.56.
Author

Sheldon McIntyre, CMT
Independent Analyst
Sheldon has 24 years of investment experience holding various positions in companies based in the United States and Chile. His core competencies include BRIC and G-10 equity markets, swing and position trading and technical analysis.


