Pepe meme coin hits new all-time high, with market cap surpassing $11 billion
- Pepe price surges to a new all-time high of $0.0000275 on Monday after rallying more than 18% in the previous week.
- PEPE’s Open interest reaches record levels, indicating new buying in the market.
- The technical outlook suggests a continuation of the rally, targeting a new all-time high of $0.0000336.

Pepe (PEPE) soars to a new all-time high (ATH) of $0.0000275 on Monday after an 18% rally over the past week. Rising open interest signals fresh market buying and the technical outlook indicates a potential climb toward $0.0000336.
Pepe market capitalization surpasses $11 billion
The recent surge in the frog-themed-based memecoin has made it surpass the $11 billion in market capitalization, according to data from CoinGecko.
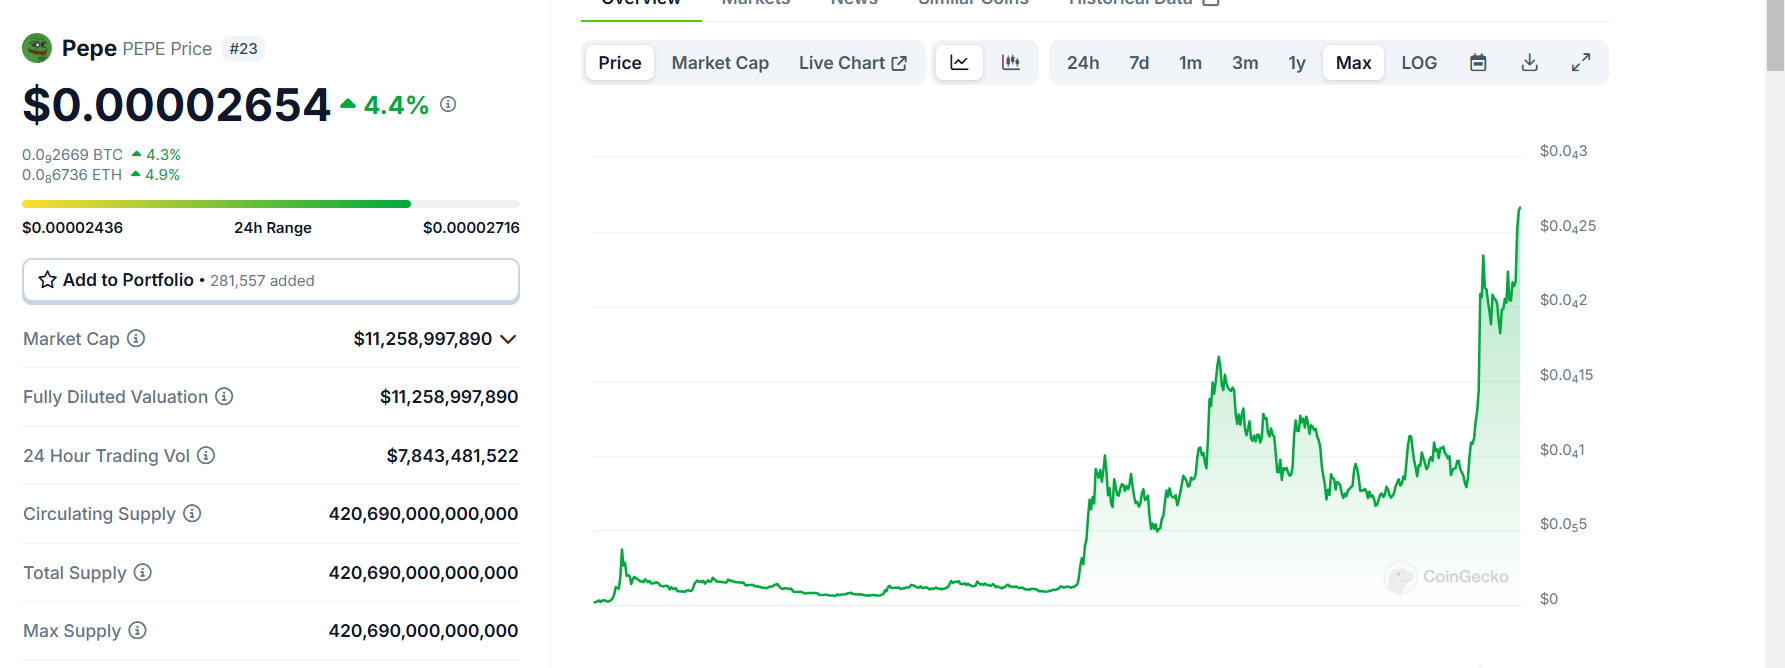
Pepe chart. Source: CoinGecko
Coinglass’s data shows that the futures’ Open Interest (OI) in PEPE at exchanges rose from $251.70 million on Saturday to $370.44 million on Monday, reaching the highest level since its launch in April 2023. An increasing OI represents new or additional money entering the market and new buying, hinting at a potential rally ahead in the Pepe price.
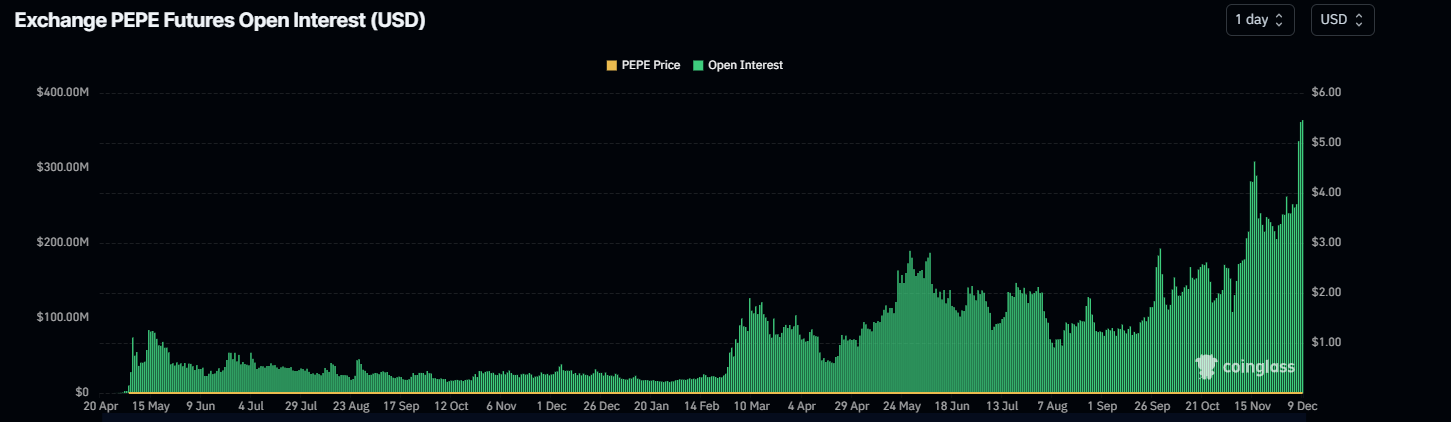
PEPE Open Interest chart. Source: Coinglass
Pepe Price Forecast: PEPE uptrend likely to continue
Pepe price broke above the descending trendline on Saturday and rallied more than 22% in a couple of days. On Monday, PEPE reached a new all-time high (ATH) of $0.0000275 and retreated afterward.
If PEPE continues its upward trend, the next target is seen at $0.0000336, the 141.40% Fibonacci extension level drawn from the November 4 low of $0.0000077 to the November 14 high of $0.0000260.
The Relative Strength Index (RSI) on the daily chart reads 68, trading close to its overbought level of 70. Traders should be cautious when adding to their long positions because the chances of a price pullback are increasing. Still, the RSI is quite stable, so there is the possibility that the rally continues and the indicator edges further up within the overbought level. A clear sell signal would occur if the RSI decisively exited overbought territory.
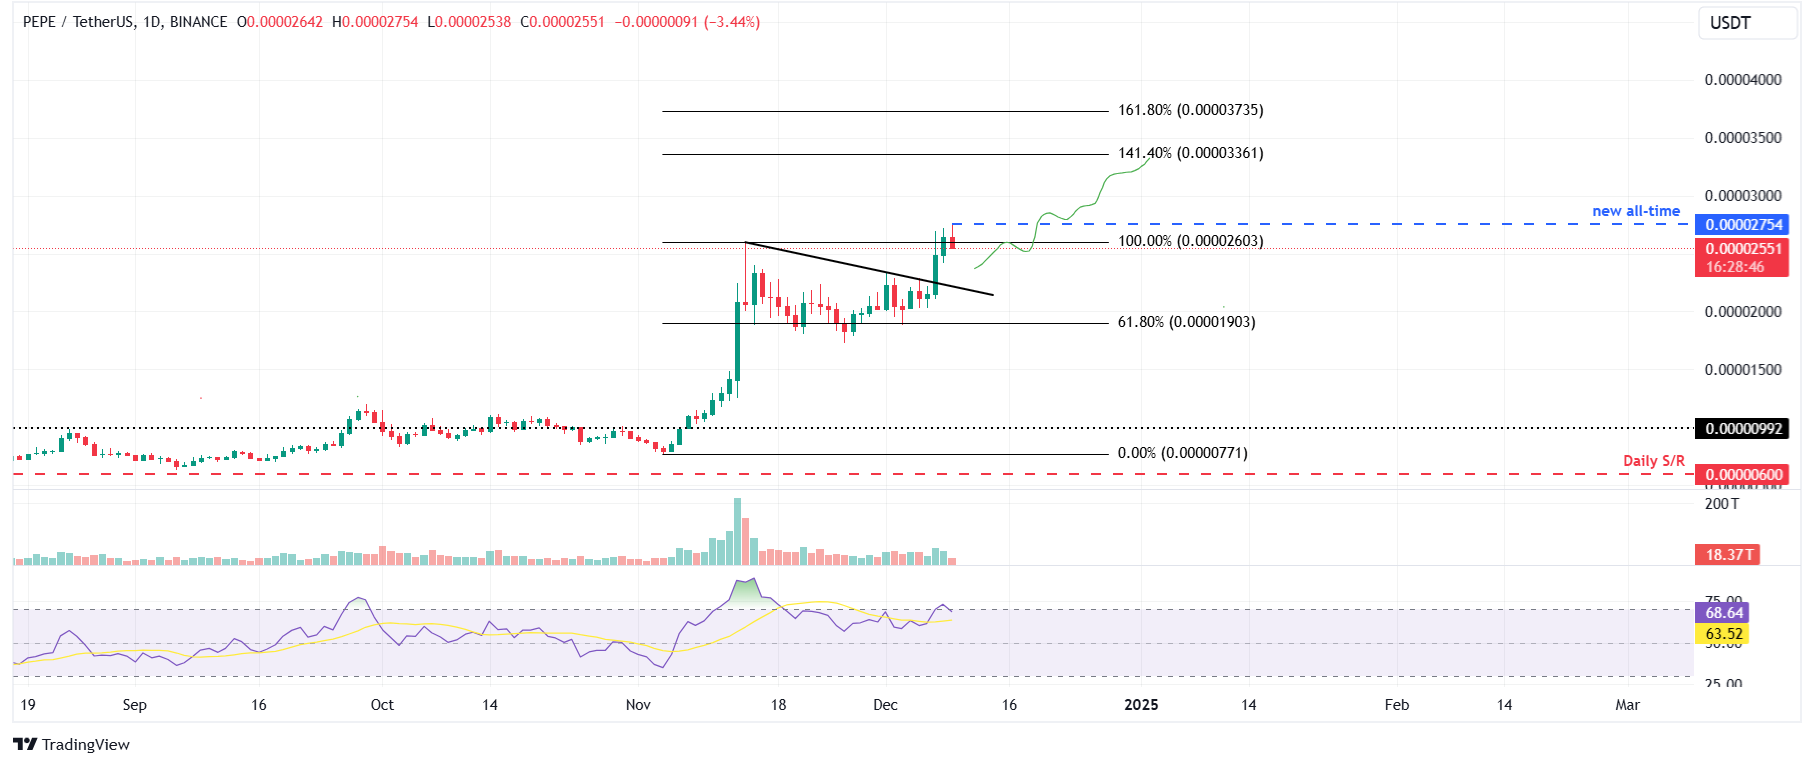
PEPE/USDT daily chart
Author

Manish Chhetri
FXStreet
Manish Chhetri is a crypto specialist with over four years of experience in the cryptocurrency industry.


