Ripple bulls falter: Profit-taking slows momentum after recent rally
- Ripple price action faces resistance around $2.66, suggesting a downturn on the horizon.
- On-chain data shows that XRP’s holders realize profits after a massive rally, increasing the selling pressure.
- A daily candlestick close above $3 would invalidate the bearish thesis.

Ripple (XRP) price trades slightly down, around $2.47, on Monday after rallying more than 13% in the previous week. On-chain data shows that XRP’s holders realize profits after a massive rally, increasing the selling pressure and indicating a short-term pullback in the upcoming days.
XRP holders selling their bags
Ripple price has gained more than four times from early November to early December. Profit-taking is another short-term risk for Ripple after such a massive rally. Santiment’s Network Realized Profit/Loss (NPL) indicator suggests holders book profits at the top. XRP’s NPL metric spiked on December 1, indicating that holders are, on average, selling their bags at a significant profit. A similar spike was seen on May 1, 2021, after rallying in the earlier month, which led to a correction of over 35% in the next two weeks. If history repeats, XRP could see a similar fall in the short term.
 [09.16.12, 09 Dec, 2024]-638693178818988917.png)
Ripple Network Realized Profit/Loss chart. Source: Santiment
According to Coinglass’s data, XRP’s long-to-short ratio is 0.85, the lowest level in one month. This ratio reflects bearish sentiment in the market, as the number below one suggests that more traders anticipate the asset’s price to fall, hinting that the Ripple price could face a pullback ahead.
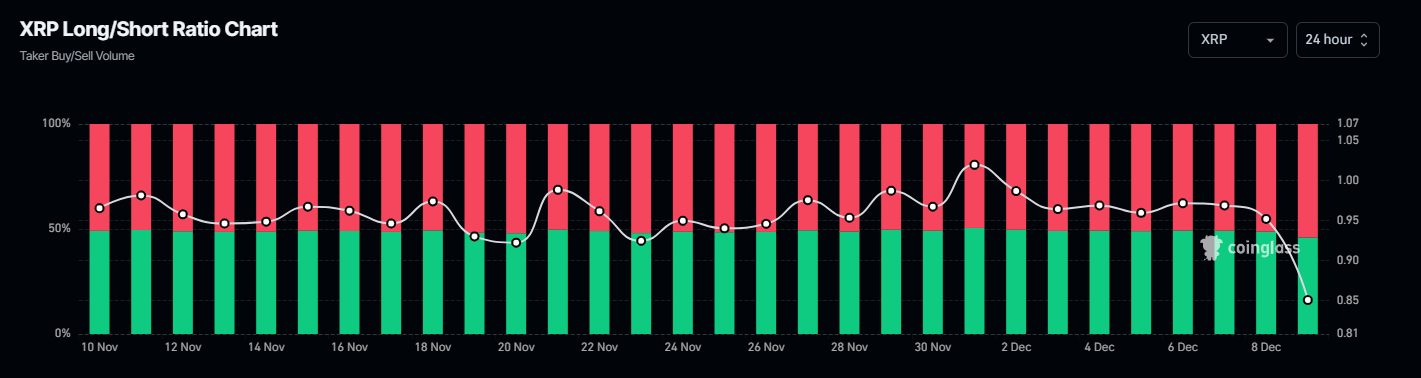
Ripple Long-to-Short ratio chart. Source: Coinglass
Ripple Price Forecast: Bulls show signs of exhaustion
Ripple price faces resistance around the $2.66 level on Sunday. At the time of writing on Monday, it trades slightly down around $2.47.
If the $2.66 level continues to hold as resistance, XRP could extend the decline to retest the psychologically important level of $2.00.
The RSI on the daily chart reads 70, hovering around the overbought level of 70, and points downwards, indicating weakness in bullish momentum. If the RSI exits overbought territory, it could provide a clear sell signal for a pullback.
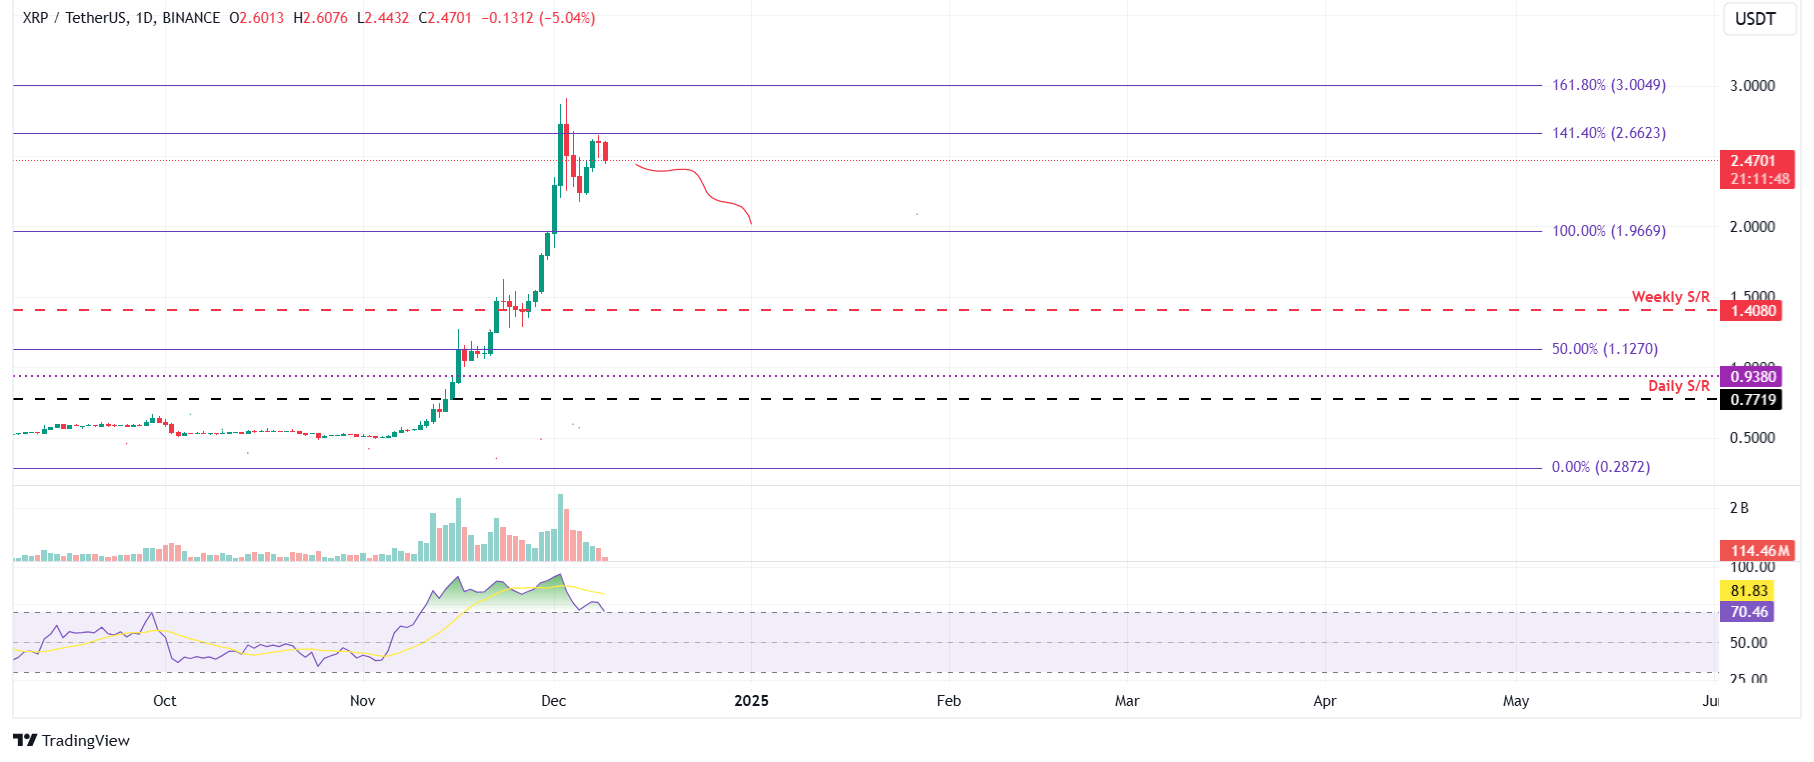
XRP/USDT daily chart
Conversely, if XRP breaks above $2.66 and closes above $3, it could extend the rally and retest its all-time high (ATH) of $3.40, seen on January 7, 2018.
Ripple FAQs
Ripple is a payments company that specializes in cross-border remittance. The company does this by leveraging blockchain technology. RippleNet is a network used for payments transfer created by Ripple Labs Inc. and is open to financial institutions worldwide. The company also leverages the XRP token.
XRP is the native token of the decentralized blockchain XRPLedger. The token is used by Ripple Labs to facilitate transactions on the XRPLedger, helping financial institutions transfer value in a borderless manner. XRP therefore facilitates trustless and instant payments on the XRPLedger chain, helping financial firms save on the cost of transacting worldwide.
XRPLedger is based on a distributed ledger technology and the blockchain using XRP to power transactions. The ledger is different from other blockchains as it has a built-in inflammatory protocol that helps fight spam and distributed denial-of-service (DDOS) attacks. The XRPL is maintained by a peer-to-peer network known as the global XRP Ledger community.
XRP uses the interledger standard. This is a blockchain protocol that aids payments across different networks. For instance, XRP’s blockchain can connect the ledgers of two or more banks. This effectively removes intermediaries and the need for centralization in the system. XRP acts as the native token of the XRPLedger blockchain engineered by Jed McCaleb, Arthur Britto and David Schwartz.
Author

Manish Chhetri
FXStreet
Manish Chhetri is a crypto specialist with over four years of experience in the cryptocurrency industry.



