One false breakout is a sign on the wall in Shiba Inu
- Shiba Inu price action is set to close the week at a weekly loss.
- SHIB price has seen bulls trying to break above a bearish power.
- Expect a bull trap to be formed now, but the summer seasonality to see it overturn further down the line.

Shiba Inu price is set to close out the week with a loss after the bullish soft patch in the last week of June. Where some cryptocurrencies saw a complete collapse of the price action with lower lows against the lows from last week, SHIB price looks in far better shape and still has the bearish cap in hindsight, with bulls set to strike at any moment. For now, expect the bearish momentum to overweigh, but a turn in sentiment looks to happen over the coming summer weeks.
SHIB price could be set for a slim 20% decline
Shiba Inu price slipped further to the downside after price action tried to pop above and break the 55-day Simple Moving Average (SMA) that has been hanging over the price action as a watchdog keeping the downtrend in play. Bulls saw their attempt cut short and got trapped in a bull trap, squeezing them to the downside and trying to have them cut their losses. However, an acceleration to the downside did not happen, as seen with some other cryptocurrencies.
SHIB price could still slide below July’s new monthly pivot at $0.00000984 and close there on Sunday night, with possibly $0.00000800 as a target around the S1 support level. With the pivots of July much close together, support and resistances will mute price action even further and see momentum building for a breakout. To the downside, that could still mean a drop to $0.00000507.
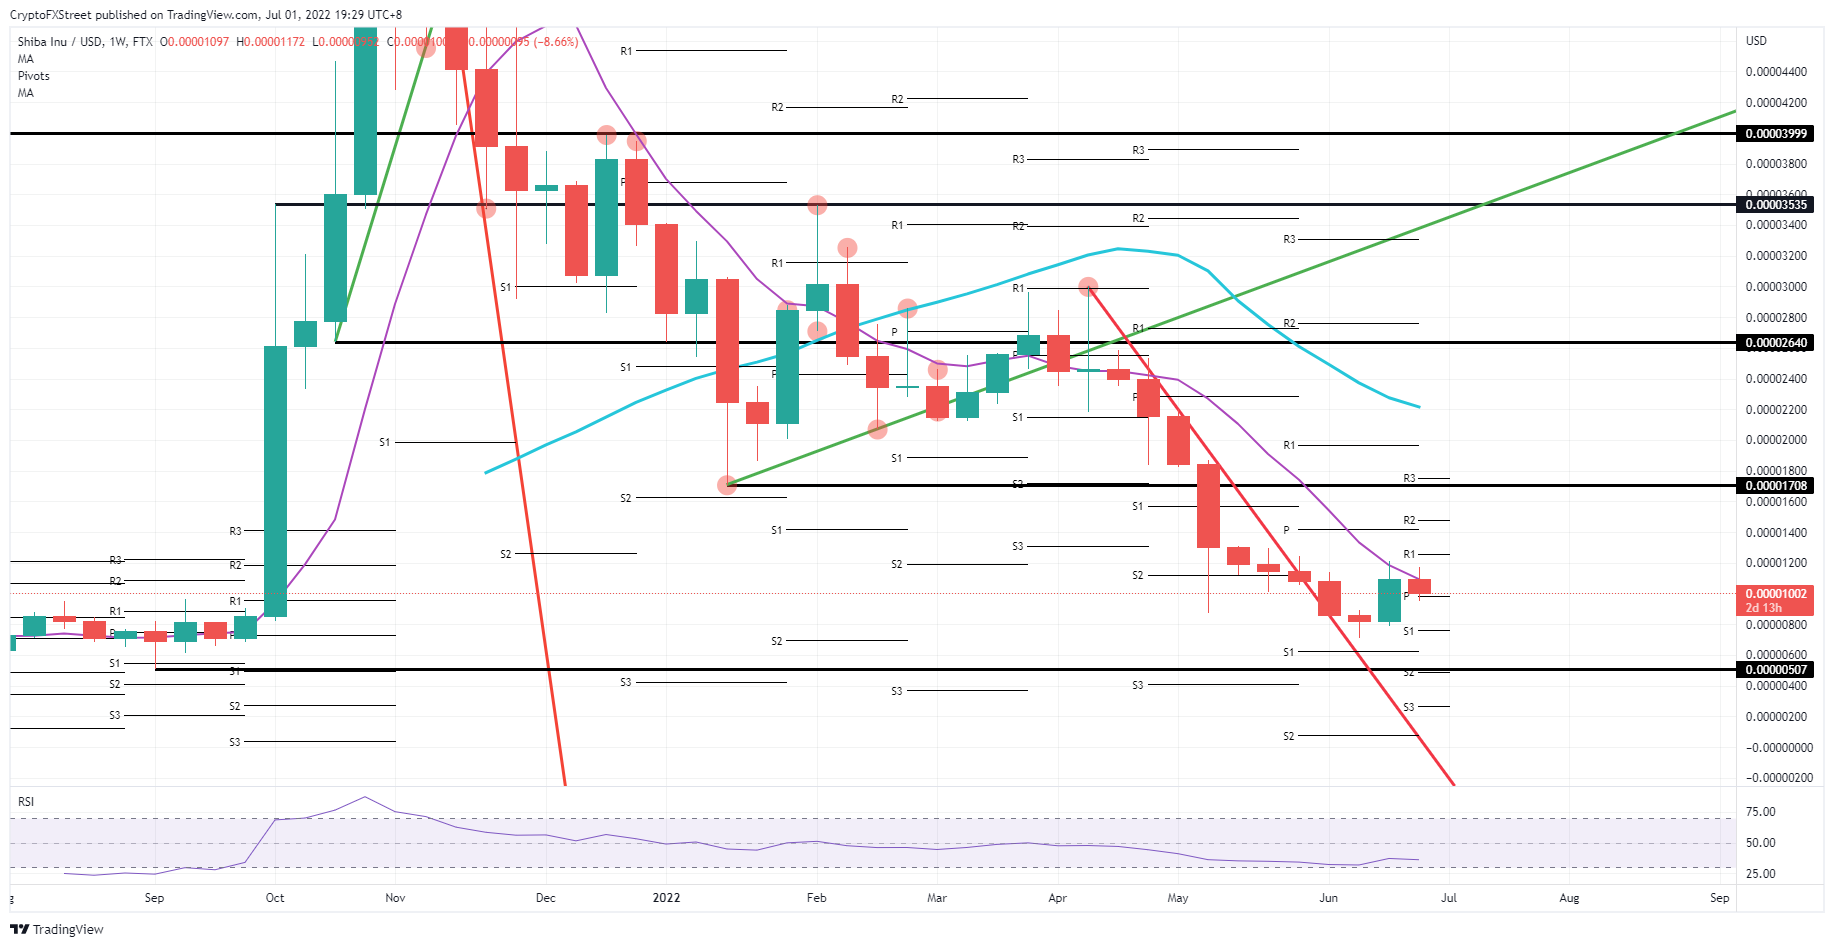
SHIB/USD weekly chart
However, a weekly close above the 55-day SMA would be a big game-changer and could even prelude the end of the downtrend as we know it. As mentioned in the previous paragraph, with the tighter pivot levels, a break to the upside could easily rally to $0.00001708, as the summer seasonality always comes with thinner liquidity and, in correlation to that, more significant price moves. That would mean that the whales who bought into the price action a few weeks ago were on to something as they will be looking at a shiny 110% gain.
Author

Filip Lagaart
FXStreet
Filip Lagaart is a former sales/trader with over 15 years of financial markets expertise under its belt.




