Shiba Inu price shows concerning signals, who will conquer the trend?
- Shiba Inu price shows concerning signals on the Volume Profile indicator.
- SHIB price coils within the 8- and 21-period simple moving averages.
- Invalidation of the downtrend is a breach above $0.00001223.
Shiba Inu price shows subtle sell signals to end the month of June. Another liquidation could occur shortly.
Shiba Inu price doesn't look right
Shiba Inu price is testing the bull's final wits of support as a profit-taking consolidation ensues within the $0.00001000 zone. This week, the bears managed to pierce through the 21-day moving average, after a buying frenzy occurred into a high at $0.00001212 on June 25. The bulls have stepped in to provide support at the 8-day moving average on the 4-hour chart, but a breach below this barrier could induce a massive sweep-the-lows event targeting the June 18 swing low at $0.00000714.
Shiba Inu price from a volume indicator perspective looks skewed. If you look closely, you may notice a rise in bearish volume while the notorious dog coin increases in value around the June 25 rally. This is a subtle bearish indicator that some of the best professional traders can overlook with an untrained eye on smart money volume patterns. If the technicals are genuine, the move has already been put in place, and a bearish cross of the SMAs or a breach of the supportive 8-day SMA could be the catalyst for a devastating sell-off.
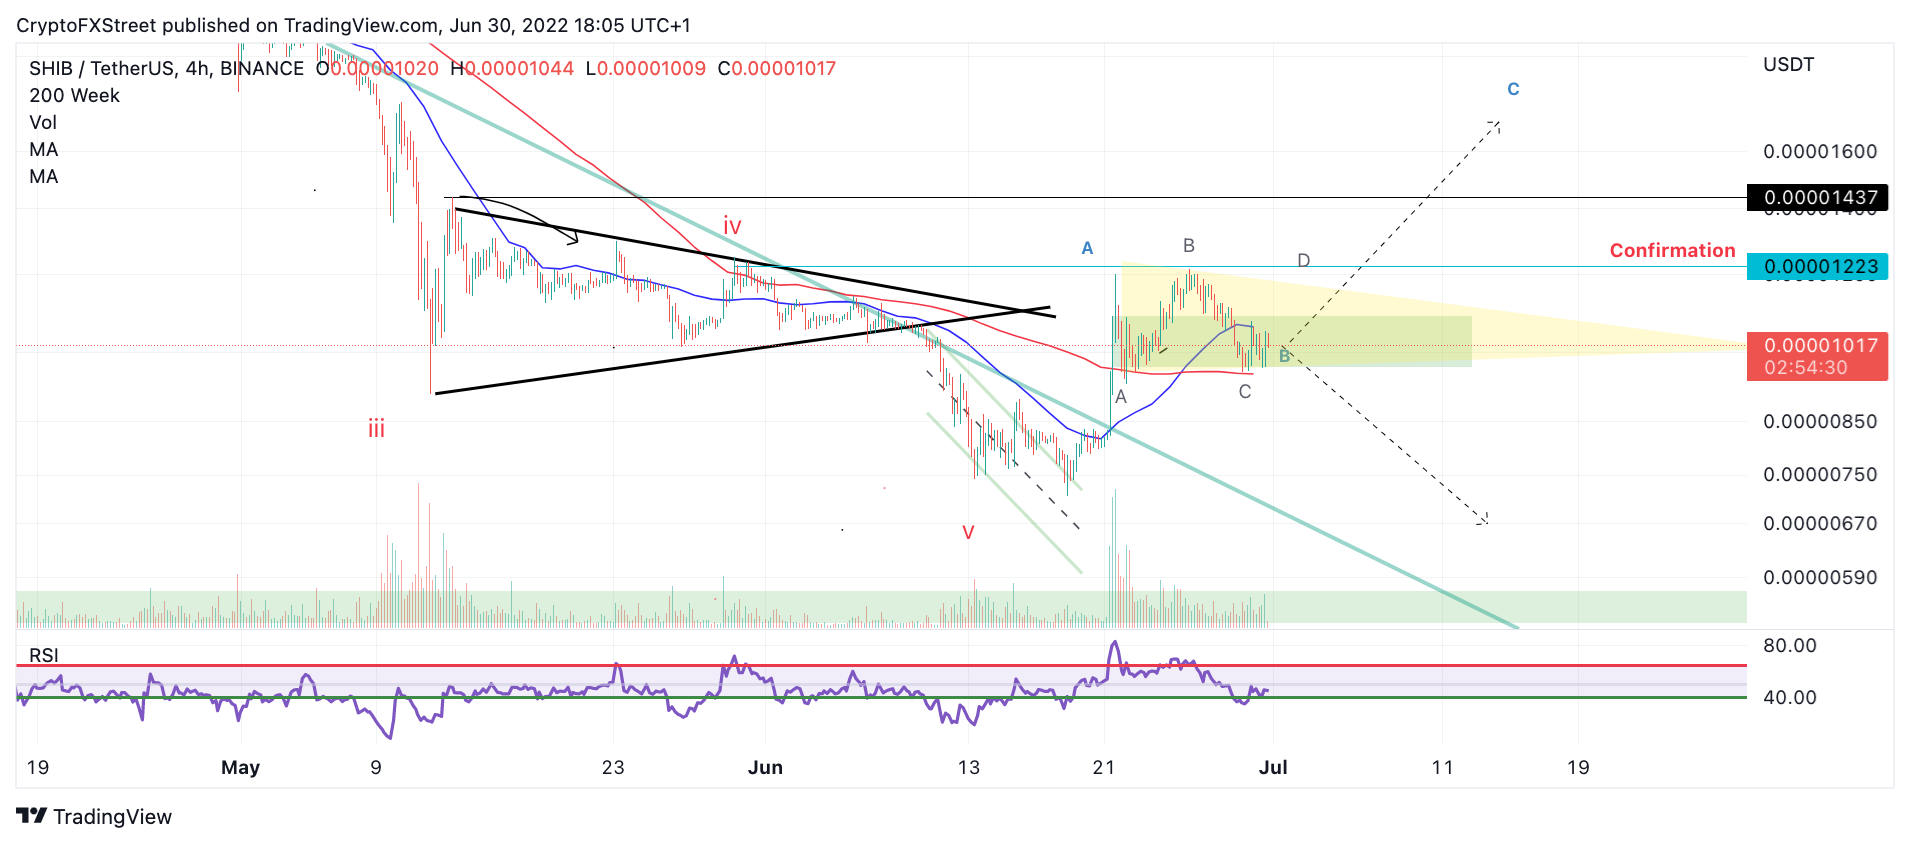
SHIB/USDT 4-Hour Chart
Invalidation of the bearish downtrend is a breach and close above $0.00001223. If the bulls can conquer this level, they may be able to rally as high as $0.00001700, resulting in a 60% increase from the current Shiba Inu price.
Author

Tony M.
FXStreet Contributor
Tony Montpeirous began investing in cryptocurrencies in 2017. His trading style incorporates Elliot Wave, Auction Market Theory, Fibonacci and price action as the cornerstone of his technical analysis.


