MATIC Price Prediction: Polygon upside potential capped at 13%
- MATIC price shows bullish momentum despite being stuck between the 50-day SMA and 100-day SMA.
- Investors can expect Polygon to see a temporary 13% run-up to $2.43, where it will face a decisive moment.
- A six-hour candlestick close below the 100-day SMA at $1.91 will invalidate the bullish thesis.

MATIC price is in a tough spot due to its upswings in the last week of December 2021. Although Polygon could see an uptrend, the bulls will face an extremely resilient resistance barrier that will likely stop Polygon dead in its tracks.
MATIC price ready for a minor comeback
MATIC price set up a higher high on December 27, 2021, at $2.93, which also happens to be the all-time high. This run-up failed to sustain, leading to a steep correction that sliced through the demand zone, extending from $2.43 to $2.63, flipping it into a breaker.
Since reaching its all-time high, Polygon has crashed 27% to where it currently trades - $2.12, stuck between the 50-day Simple Moving Average (SMA) at $2.19 and the 100-day SMA at $1.91. MATIC price bounced off the weekly support level at $1.94 and is heading toward the 50-day SMA, which could evolve into a 10% uptrend to $2.35. Beyond this level, Polygon could retest the breaker, stretching from $2.43 to $2.63, bringing the total climb to 13%.
However, market participants should note, MATIC price will likely face rejection at the said barrier, leading to a retest of the 50-day SMA at $2.19 before deciding on a directional bias.
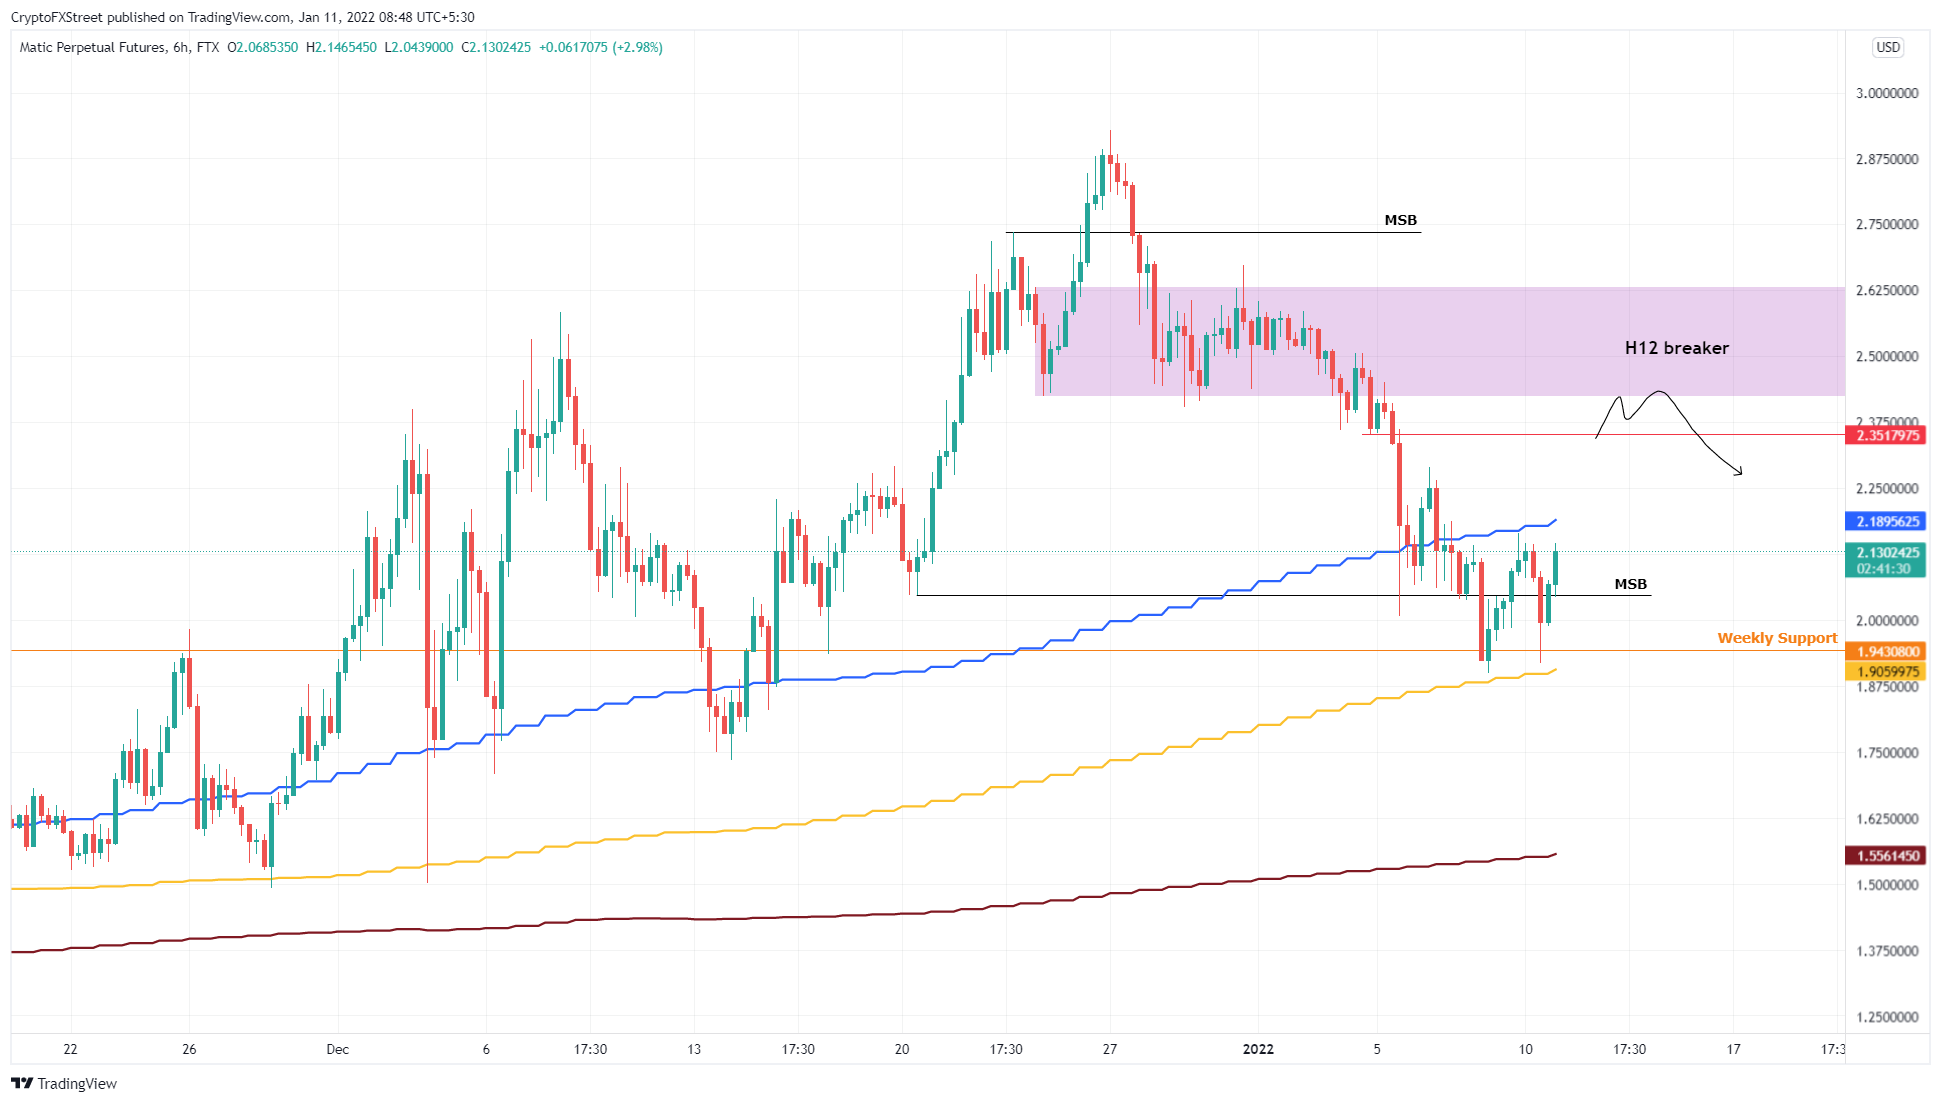
MATIC/USDT 6-hour chart
Supporting this short-term uptrend to $2.42 for MATIC price is IntoTheBlock’s Global In/Out of the Money (GIOM) model, which shows non-existent resistance barriers up to $2.48.
The only meaningful cluster of underwater investors extends from $2.82 to $2.21. Here, roughly 55,510 addresses that purchased 451.84 million MATIC tokens at an average price of $2.48 are “Out of the Money.”
Therefore, a move into this territory could lead to these underwater investors wanting to break even, causing a spike in selling pressure, explaining the rejection from the breaker explained above.
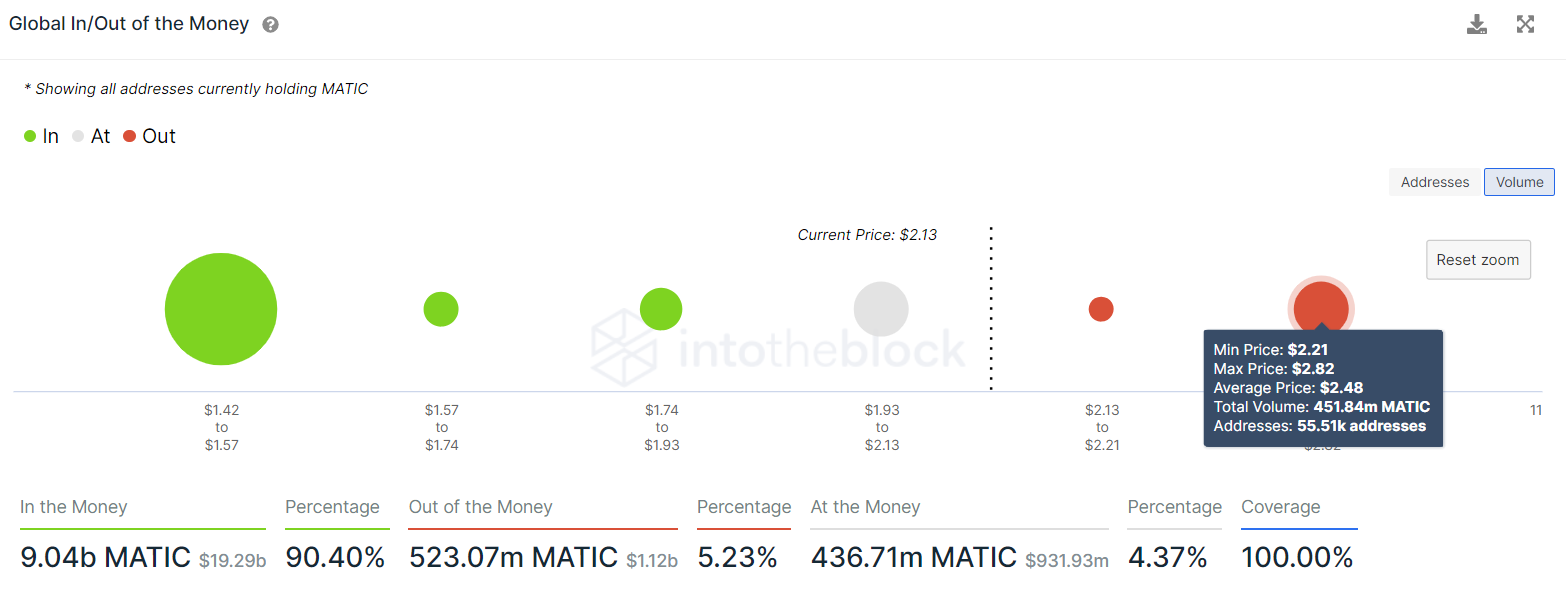
MATIC GIOM
Further explaining the pickle that Polygon is in is Santiment’s Network Growth metric, which has dropped roughly 46% since the all-time high at $2.93 on December 27, 2021. This on-chain index measures the number of new addresses joining the network and can indicate if the project is gaining traction or losing it.
For Polygon, the network growth has dropped from 4,693 to 2,535, representing a net decline, suggesting that investors are not interested in MATIC price at the current levels.
 [08.10.55, 11 Jan, 2022]-637774747405709004.png)
MATIC network growth
If MATIC price produces a six-hour candlestick close below the 100-day SMA at $1.91, it will invalidate the bullish thesis. This development opens the path for Polygon to retest the 200-day SMA at $1.56.
Author

Akash Girimath
FXStreet
Akash Girimath is a Mechanical Engineer interested in the chaos of the financial markets. Trying to make sense of this convoluted yet fascinating space, he switched his engineering job to become a crypto reporter and analyst.


