|

Polygon (MATICUSD) should see further downside short term

Polygon (formerly Matic Network, MATICUSD) is a Layer 2 scaling solution backed by Binance and Coinbase. The project seeks to stimulate mass adoption of cryptocurrencies by resolving the problems of scalability on many blockchains. Polygon combines the Plasma Framework and the proof-of-stake blockchain architecture.

MATICUSD daily chart
Chart

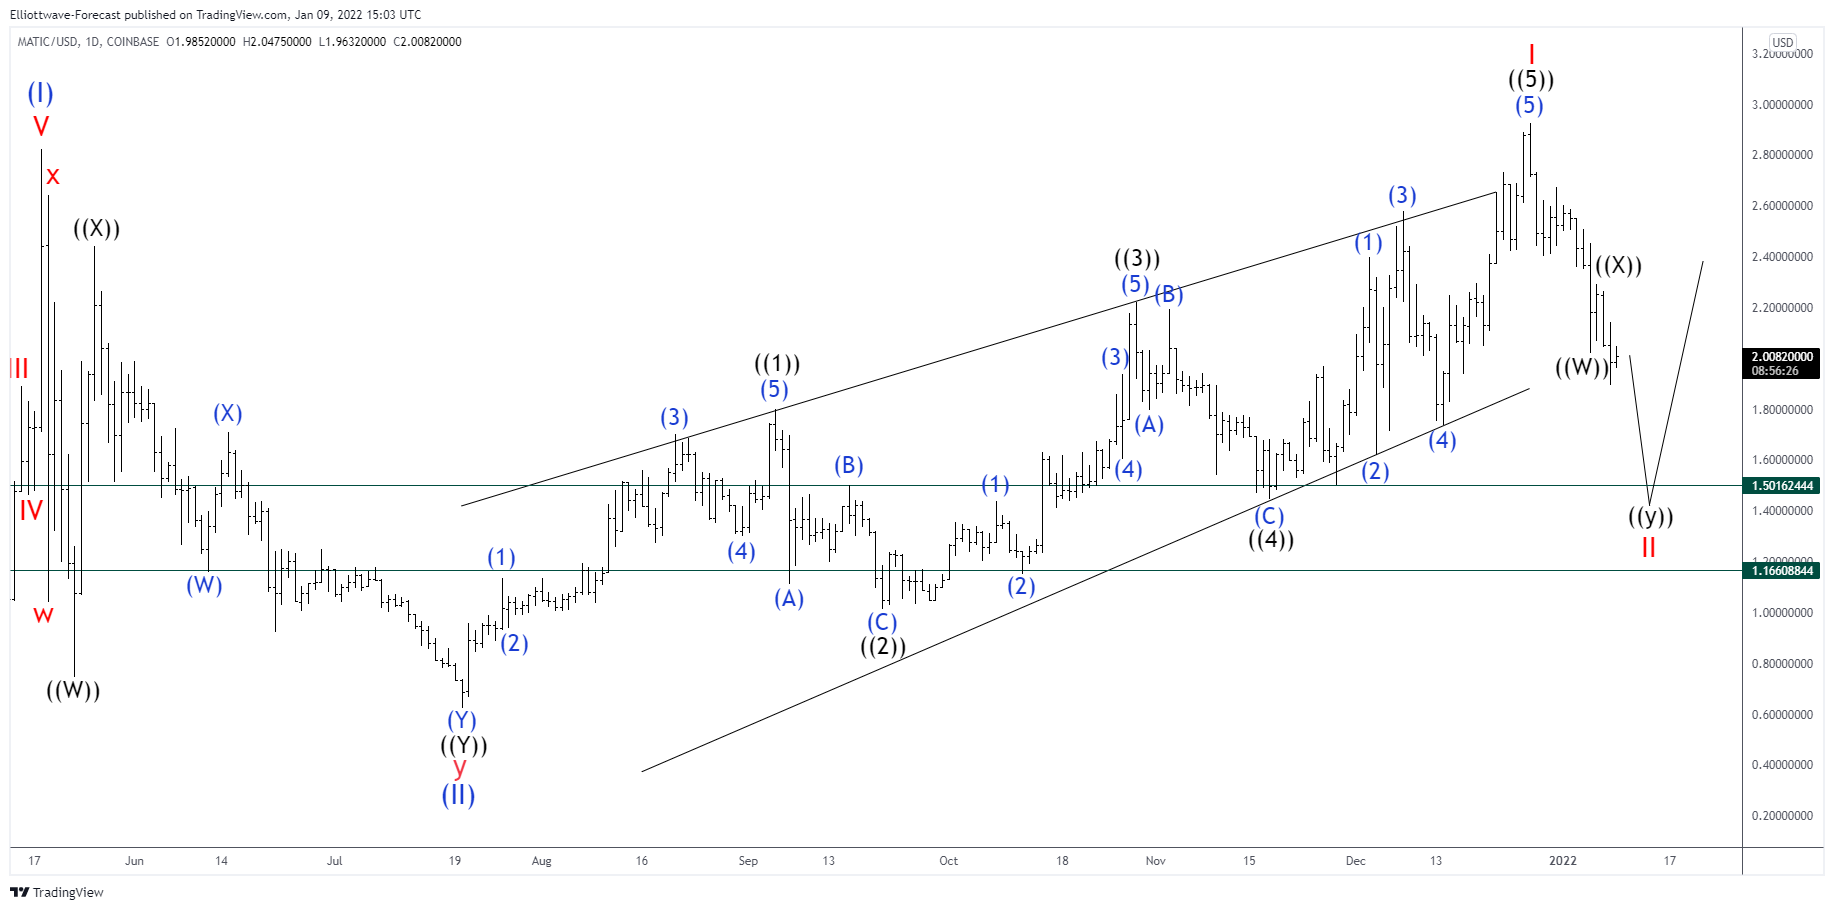
MATICUSD started a rally from July 20 th 2021 low. From there we can see 5 waves up forming a Leading Diagonal Structure ending on December 27 th. (If you want to learn more about Elliott Wave Theory, please follow these links: Elliott Wave Education and Elliott Wave Theory). Wave ((1)) ended an impulse structure at 1.7991. Then MATICUSD corrected in 3 swings making a zig-zag structure, ending wave ((2)) at 1.0148. Another rally resumed from the low completing wave ((3)) at 2.2200 and pullback again making a flat correction ended wave ((4)) at 1.4446. Then last push higher made an ending diagonal structure and completed wave ((5)) and wave I of the leading diagonal at 2.9249.

At the end of December, the cryptocurrency dropped strongly losing more than 15%. MATICUSD continued falling, in 3 swings, to 2.0210 and we labeled this movement as wave ((W)). Then we have seen a bounce ending at 2.2919 and turn lower again. We labeled the bounce as wave ((X)) and from here we are calling 3 swings more down to draw a double correction structure to end wave ((Y)) and wave II. To conclude the whole correction as wave II we are suggesting a 1.5016 – 1.1660 area where MATICUSD should continue with the rally.

Author

Elliott Wave Forecast Team

Elliott Wave Forecast Team

ElliottWave-Forecast.com

More from Elliott Wave Forecast Team
Share:

Editor's Picks

Top Altcoins Price Forecast: XRP and ADA rebound as DOGE lags behind

The broader cryptocurrency market shows early signs of a bullish recovery, with Bitcoin rising above $65,000 amid improving retail sentiment. Top altcoins, including Ripple and Cardano, are gaining bullish momentum, while Dogecoin continues to consolidate, holding above a crucial support zone.

Ripple and Stellar outlook: Mixed signals keep traders at a crossroads

Ripple and Stellar trade within tight ranges as traders await the next directional move. XRP’s technical indicators suggest bearish momentum is fading, while XLM continues to consolidate near a critical support zone. Mixed derivatives metrics highlight growing market indecision, raising the likelihood of a volatile breakout in either direction in the coming days.

Shiba Inu Price Forecast: Extends gains as on-chain and derivatives metrics confirm bullish bias

Shiba Inu extends gains, trading above $0.0000042 after breaking above the descending trendline the previous day. Strengthening on-chain data and improving derivatives metrics support further gains for the meme coin. CryptoQuant’s exchange netflow chart below shows five consecutive days of net outflows since July 17.

Bitcoin climbs above $65K as ETF flows recover despite rising macro risks
Bitcoin (BTC) has climbed above $65,000 on Monday as improving onchain activity, recovering US spot Bitcoin exchange-traded fund (ETF) flows, and stabilizing derivatives point to a more balanced market, according to Glassnode.
Bitcoin’s potential recovery in the second half hinges on these 4 catalysts
Bitcoin (BTC) has fallen over 34% in the first half of this year as the King Crypto failed to capitalize on a good semester for risk assets despite the woes from the Iran war.



