MATIC at a make-or-break level that could see Polygon drop to $1.50
- MATIC price falls below rising wedge pattern.
- Bulls struggle to keep MATIC above critical support levels within the Ichimoku Kinko Hyo system.
- Bears are likely to take over if a bearish breakout is confirmed.

MATIC price action has undoubtedly faced massive pressure since hitting new all-time highs less than two weeks ago. As a result, the return inside the rising wedge quickly turned into a solid bearish event which could portend significant bearish price action in the future.
MATIC price action to confuse and confound both sides of the market
MATIC price is most definitely leaning on the bearish side of the trend. Friday was the first time that MATIC closed below the lower rising wedge trendline since the pattern was confirmed last Fall.
Bulls attempted to rally MATIC price to a close above the lower trendline but were stubbornly rejected. The Saturday close added to the bearish behavior by closing below the Cloud – the first time since October 14. While the price action is bearish, there may be some reprieve up ahead, albeit temporary.
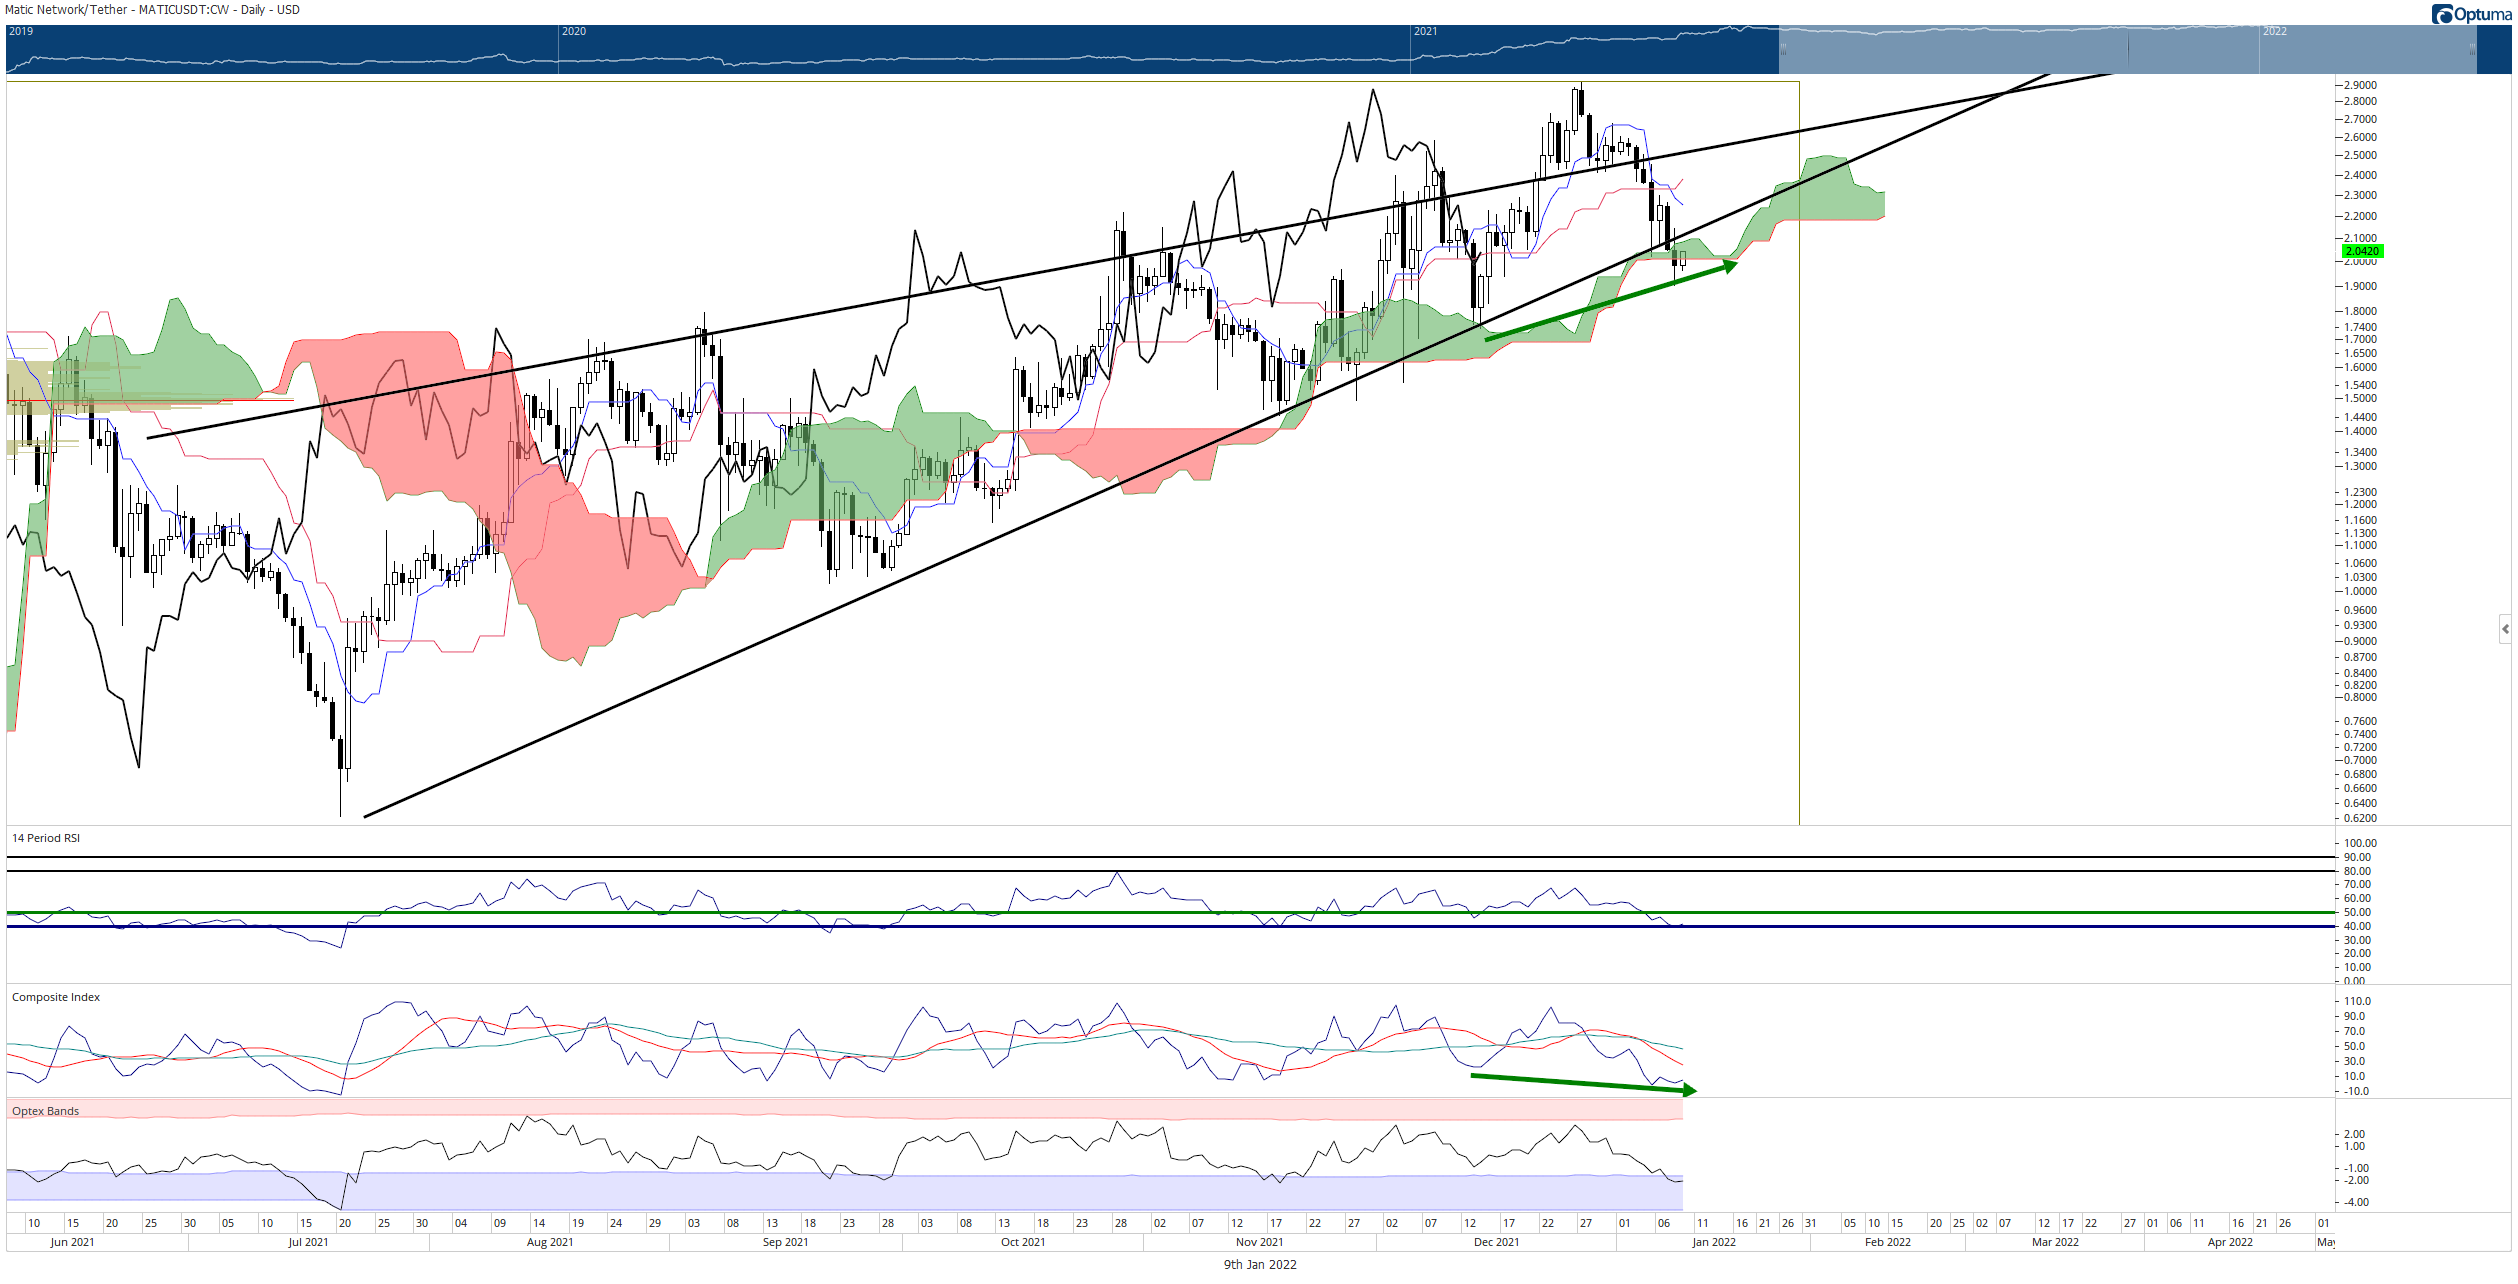
There is significant support where MATIC price is presently trading. The $2.00 level contains a high volume node in the Volume Profile and the bottom of the Cloud (Senkou Span B).
Senkou Span B is the most substantial level of support/resistance in the Ichimoku Kinko Hyo system – when oscillators develop bullish divergences, extreme oversold conditions and price action is at a critical Ichimoku support level, bounces often occur.
The Relative Strength Index shows it is trading above the final oversold level in a bull market (40), with the slope of the RSI line now pointing up. Next, the Optex Bands oscillator has shifted into extreme oversold levels, the lowest level since July 19. But Composite Index is the most vital oscillator to pay attention to.
The green arrows on the chart (one under the MATIC price candlesticks and one under the line of the Composite Index) show two different directions. The candlestick chart shows higher close and higher lows, while the Composite Index shows lower lows. This is a form of divergence known as hidden bullish divergence – a warning sign to bears that an uptrend is about to take over.
However, MATIC price bulls should be wary of any failure to close above the lower trendline of the rising wedge. Failure to close above that zone could confirm the bearish breakout and shift Polygon below the $2.00 level for a long time.
Author

Jonathan Morgan
Independent Analyst
Jonathan has been working as an Independent future, forex, and cryptocurrency trader and analyst for 8 years. He also has been writing for the past 5 years.


