MATIC Price Prediction: Polygon to retest $2.40 after hitting new all-time highs
- MATIC price action has been a clear leader, outperforming the broader cryptocurrency market.
- Massive, bullish signal forms after MATIC clearly rejects one of the most bearish chart patterns in technical analysis.
- Bulls target the critical $3 level next, with the $5.50 range after that.

MATIC price has surged by more than 57% in just ten trading days. Concerns about whether it could make another breakout attempt of the upper trendline of a rising wedge have been handily dispelled. However, a pullback in the interim is expected.
MATIC price to cool-off and assess its recent moves, pullback incoming
MATIC price has two scenarios coming up that traders should be prepared for. The first is a pullback to the $2.40 value area. $2.40 is where the top of the current rising wedge pattern and daily Tenkan-Sen reside. A pullback to this level is a move that both long-term investors and short-term speculators should want to occur.
A retest of $2.40 that holds as support would confirm that the current breakout was legitimate. There have been five attempts since October 27 by MATIC bulls to breakout above the rising wedge, but all have failed and resulted in a return inside the rising wedge pattern.
Another reason a pullback is increasingly probable is the gap between the bodies of the daily candlesticks and the Tenkan-Sen (blue moving average). Gaps between the Tenkan-Sen and the bodies of candlesticks do not last long and often correct no later than four to six periods after the first gap. MATIC price is within that range for the pullback to occur.
The second scenario that traders should look out for is a consolidation phase. The consolidation phase would be a temporary pause where MATIC would likely trade between the $2.60 and $2.75 value areas. That consolidation would last until the Tenkan-Sen and Kijun-Sen cross above the rising wedge's upper trendline – roughly two weeks from December 24.
The $3 price level is the next central zone for MATIC price to test. $3 is a solid psychological level and near the 100% Fibonacci expansion at $2.93. Above that, a massive breakout towards the 161.8% Fibonacci retracement is next.
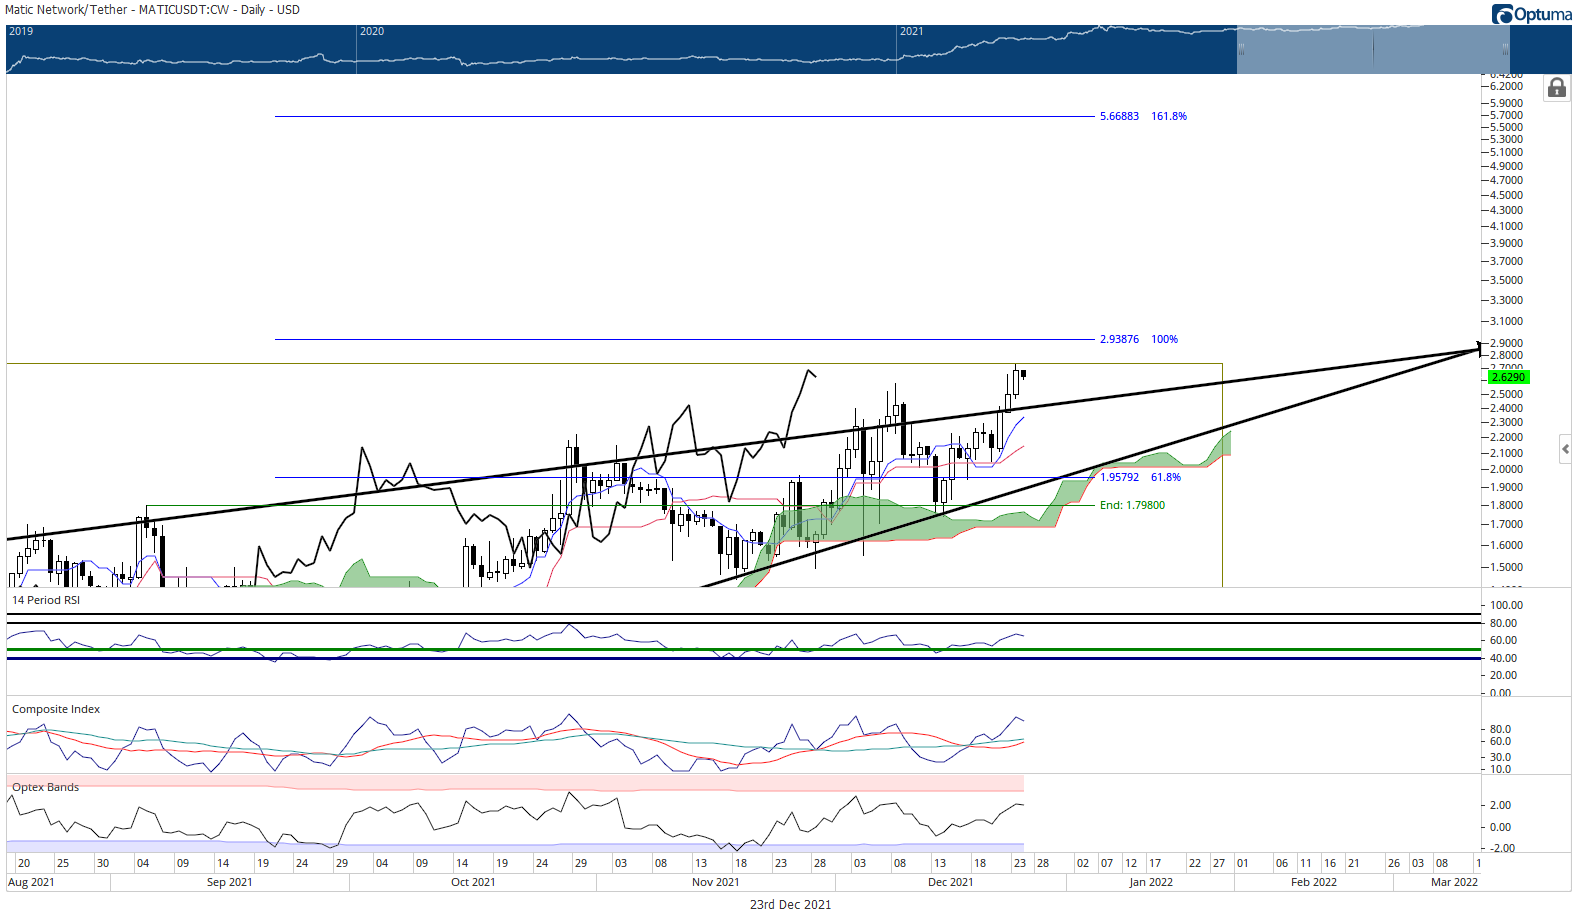
For this bullish outlook to be invalidated, bears would need to push MATIC price to a daily close below the rising wedge and the Ichimoku Cloud at $1.65 or lower.
Author

Jonathan Morgan
Independent Analyst
Jonathan has been working as an Independent future, forex, and cryptocurrency trader and analyst for 8 years. He also has been writing for the past 5 years.



