MATIC sets up for another push to new all-time highs
- MATIC price stuck in a rising wedge for the past four months.
- Multiple bullish and bearish attempts to breakout have all failed.
- Oscillator levels would confirm that a bullish breakout would be sustainable.

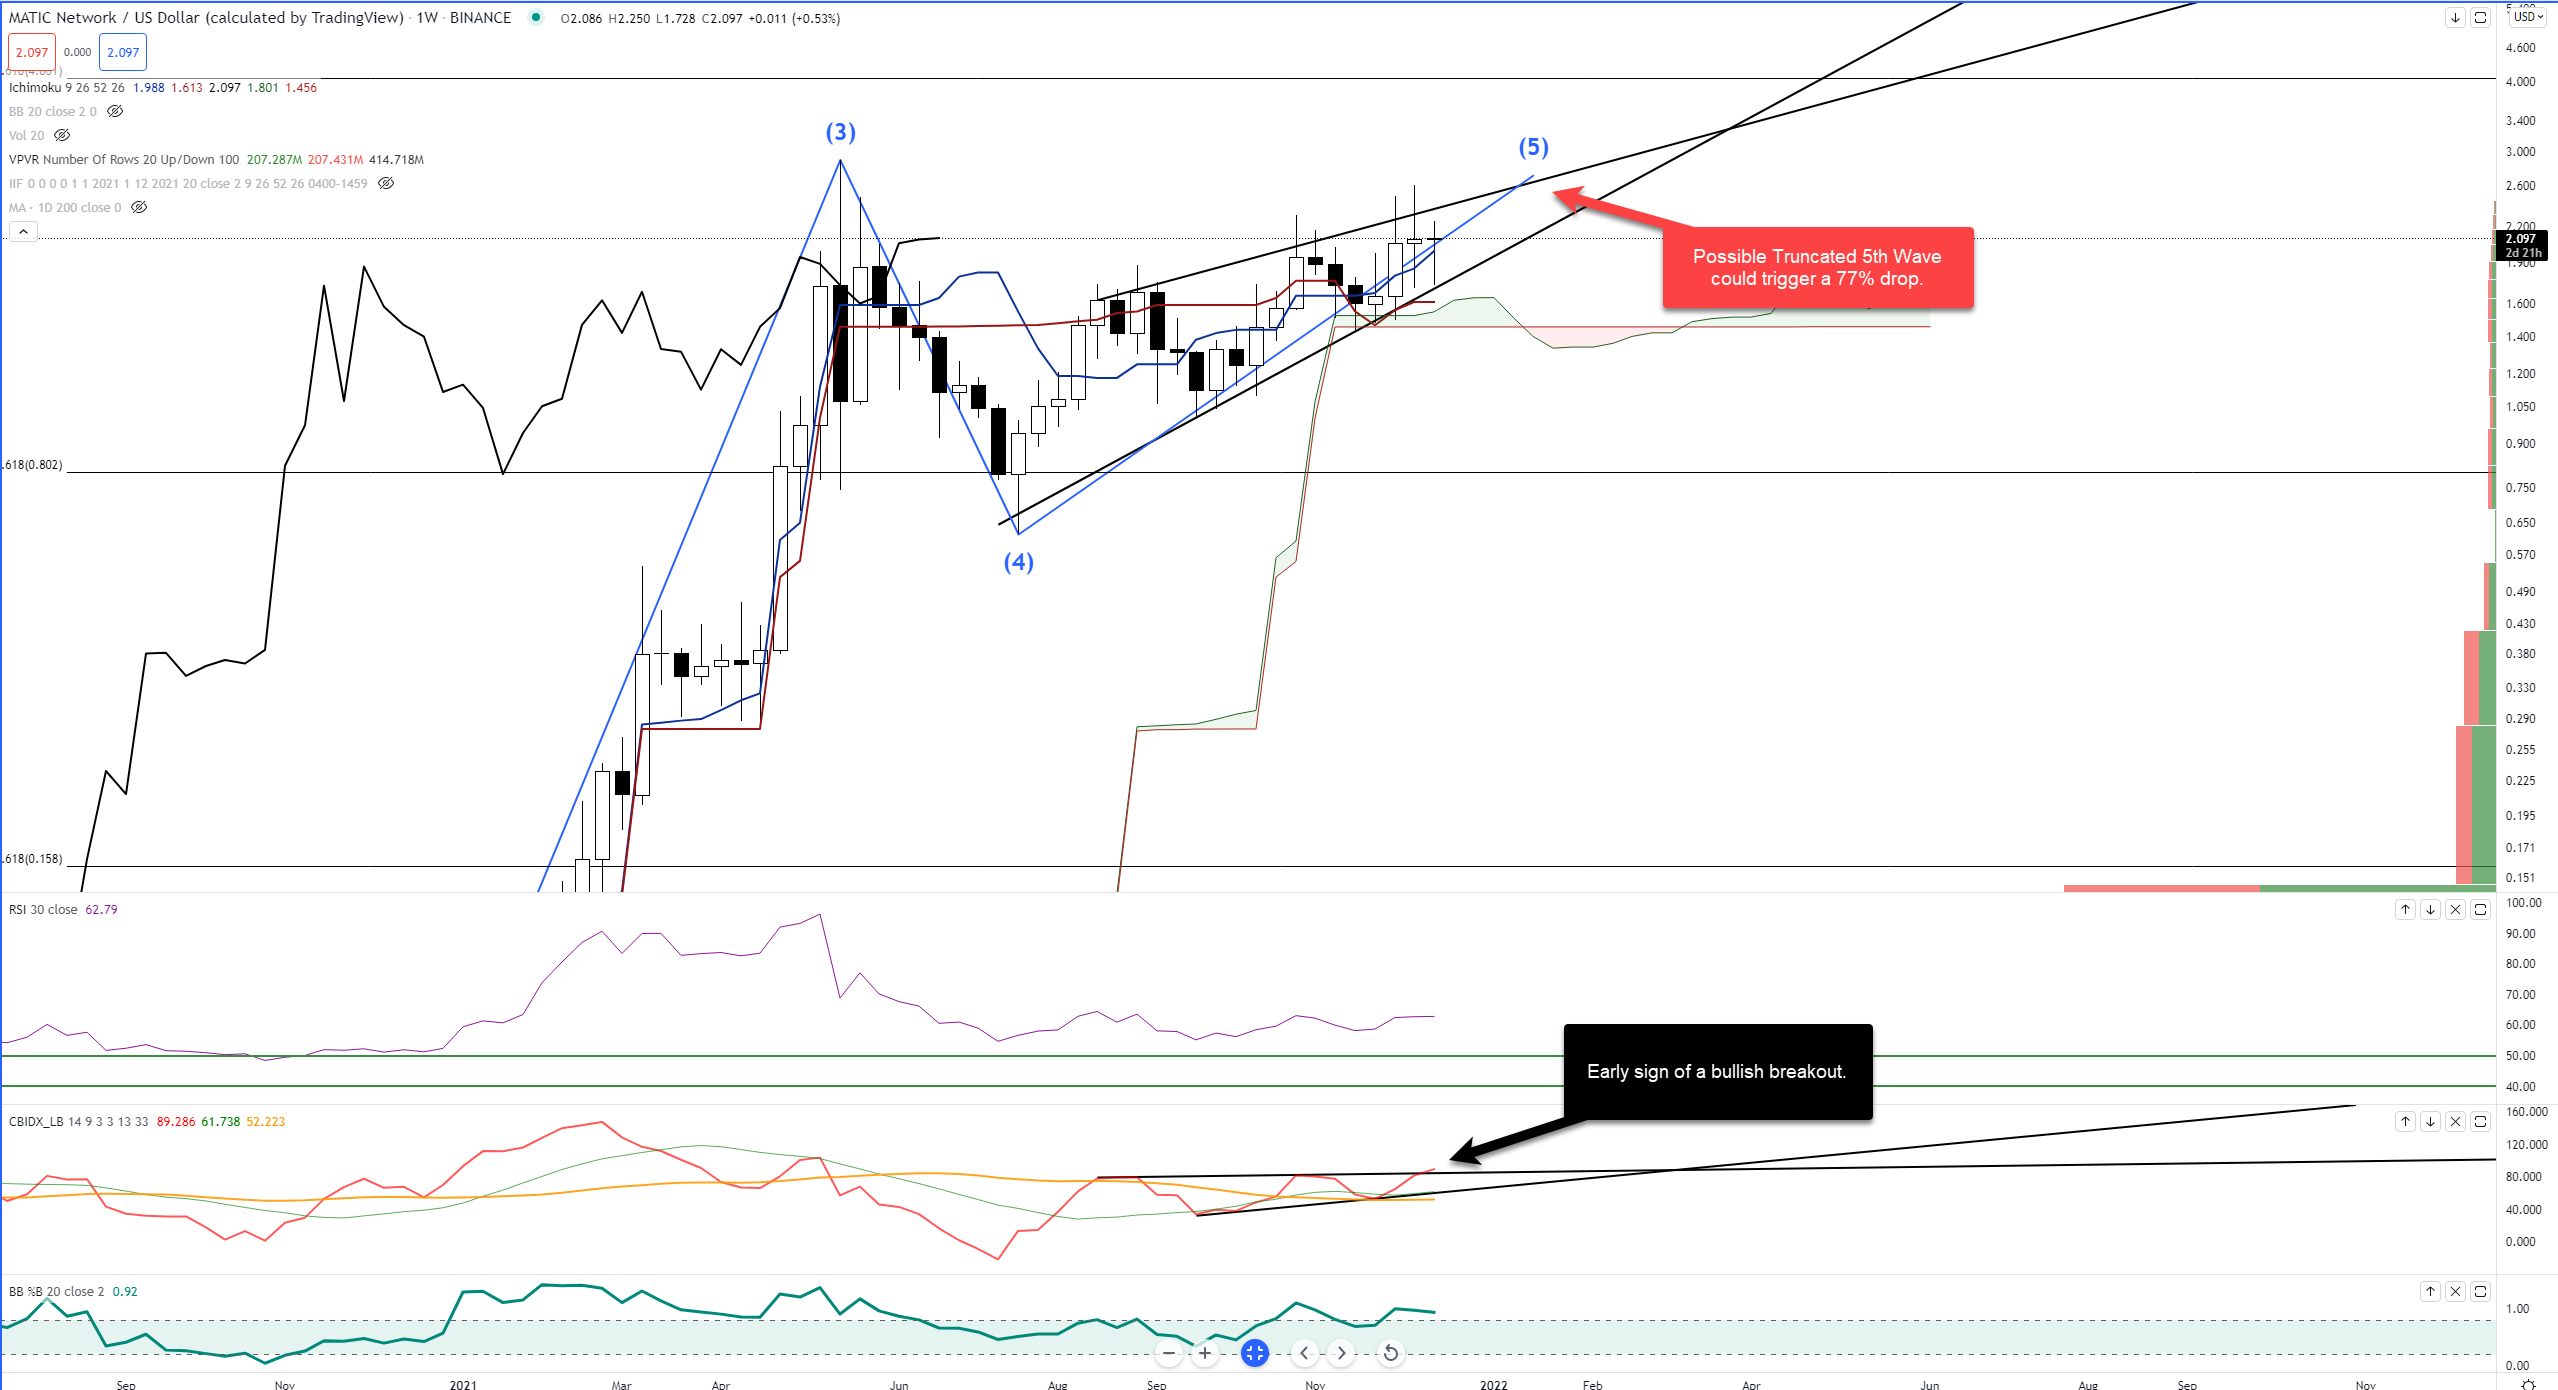
MATIC price action is developing into a fascinating and provoking technical chart. Undoubtedly, the current weekly chart will act as a supreme example by Elliot Wave enthusiasts as either a perfect example of a Truncated 5th Wave or a massive bearish fakeout. Either has yet to be determined.
MATIC price develops massive indecision pattern, one side of the market will get destroyed
MATIC price has one of the more interesting technical charts in the cryptocurrency space. In Elliot Wave Analysis, there is a rare and unpredictable pattern is known as a Truncated 5th Wave. In a nutshell, the Truncated 5th Wave is the final wave of an Impulse Wave that fails to exceed the end of Wave 3.
That MATIC has been developing a Truncated 5th Wave over four months indicates some fireworks will likely be seen when a breakout occurs. If MATIC price moves in the direction associated with this Elliot Wave pattern, a swift and violent flash-crash is coming up. Because a Truncated 5th Wave can only be confirmed if price exceeds Wave 4, then that means MATIC would need to move below the $0.62 value area.
A move to $0.62 is nearly a 77% loss in value from the prior swing high of $2.61 – a retracement percentage commonly associated with market bottoms that trigger extended bull moves. The truncation, if confirmed, is likely to be extremely limited.
However, MATIC bulls may generate shock just by continuing a bullish move up and out of the rising wedge – something that has been attempted multiple times over the past few months. The oscillator levels support any bullish breakout.
The Relative Strength Index is sitting in neutral territory; it has barely moved since the beginning of August. On the other hand, the Composite Index hints at a bullish breakout above its rising wedge. Fortunately, that possible breakout in the Composite Index is occurring while it also is in neutral territory.
MATIC/USDT Weekly Ichimoku Chart
From an Ichimoku perspective, MATIC price action is some of the strongest and clearly bullish out there. Leaning in the overall trend direction is often the wisest choice, but confirmation is always necessary. Bulls should look for a breakout to trigger moves towards the $5 value area. Bears should look for a drop to target the $0.65 price range.
Author

Jonathan Morgan
Independent Analyst
Jonathan has been working as an Independent future, forex, and cryptocurrency trader and analyst for 8 years. He also has been writing for the past 5 years.


