MATIC Price Prediction: Big upside move in danger
- MATIC price sends bearish signals moments after tagging $1.00.
- Polygon sees an increase in key fundamental factors such as whale activity.
- The resistance at $1.00 weighed down an inverse head-and-shoulders pattern breakout to $1.18.

MATIC price recovery from its floor price of $0.33 did not falter throughout July. The Ethereum Layer2 blockchain solutions provider rallied and pierced through numerous seller congestion zones unbothered by an extremely bearish crypto market. As illustrated in the daily timeframe chart below, the formation of an inverse head-and-shoulders pattern also reinforced the uptrend.
As we will see in a short while, Polygon’s fundamentals also improved immensely during the month, prompting a sustainable move. However, from a technical point of view, the accrued gains could be in jeopardy. The seller congestion at $1.00 will likely drill holes in Polygon’s sailing ship, with a downtrend predicted to stretch to $0.75 and $0.50, respectively.
Polygon whales on a buying spree
On-chain data from Santiment reveals that addresses with between 10,000 and 100,000 MATIC tokens currently account for 4.35% of the network’s total supply, up from 4.16% on July 1. Addresses in the 1 million to 10 million cohort joined the party slightly late, as observed in the chart below but increased their holdings from 5.38% to 6.92%.
The impressive uptake of MATIC tokens implies that investors have a positive long-term outlook. Hence, the possibility of MATIC price recovery regaining momentum and clearing the seller congestion at $1.00.
 (MATIC) [14.10.40, 01 Aug, 2022]-637949531096056555.png)
Polygon supply distribution
Are bears winning the tug of war?
The inverted head-and-shoulders pattern led to a MATIC price rebound from support erected at $0.33. If everything had gone according to plan, a 57.46% breakout target to $1.18 would have been achieved, but the seller congestion at $1 weakened the bulls’ influence.
At the time of writing, MATIC price trades at $0.90 while seeking higher support, preferably at $0.88. The daily Moving Average Convergence Divergence (MACD) may present a sell signal, which to a great extent, will negatively impact its outlook in the coming days.
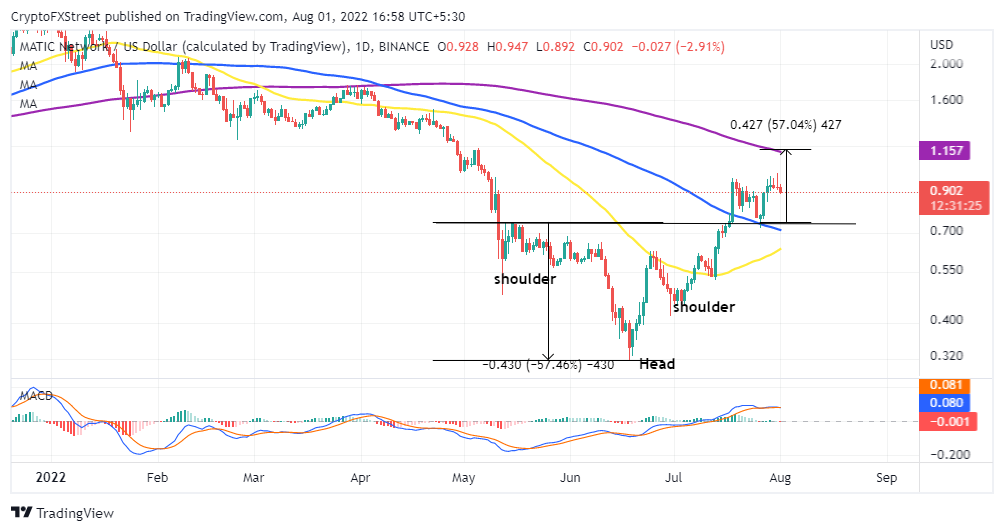
MATC/USD Daily Chart
Support is envisaged at $0.70, as highlighted by the daily 100 Moving Simple Average (SMA). Other key downhill levels to keep in mind are the daily 50 SMA and the buyer concentration zones at $0.55 and $0.40, respectively.
Author

John Isige
FXStreet
John Isige is a seasoned cryptocurrency journalist and markets analyst committed to delivering high-quality, actionable insights tailored to traders, investors, and crypto enthusiasts. He enjoys deep dives into emerging Web3 tren