MATIC Price Forecast: Polygon staring at a quick 18% decline
- MATIC price crashed through trend line support, breaking the symmetrical triangle pattern.
- IOMAP data highlights a large sum of underwater traders.
- A measured move targets a 45% decline from triangle breakdown.

MATIC price’s advance of almost 3,400% from the January low was one of the greatest highlights in the cryptocurrency complex this year. The resulting correction from the March high has taken the shape of a symmetrical triangle pattern. Today the triangle was resolved to the downside with an 11.4% decline on an intra-day basis.
MATIC price targets of $1.00 look too optimistic
As a symmetrical triangle develops, there is no apparent directional bias for how it will resolve. Still, the actual breakout or breakdown is often swift and noteworthy, and that has been the case for Polygon today. With the direction clear, traders must evaluate potential levels for support or take on new risk.
Based on the swift break, MATIC may quickly test the 0.50 retracement of the advance from the November 2020 low to the March high, producing an 18% decline from the current price. The 0.618 Fibonacci retracement at $0.215 intersects with some price congestion in the first half of March.
An absolute collapse would put the measured move of the symmetrical triangle in play at $0.192.
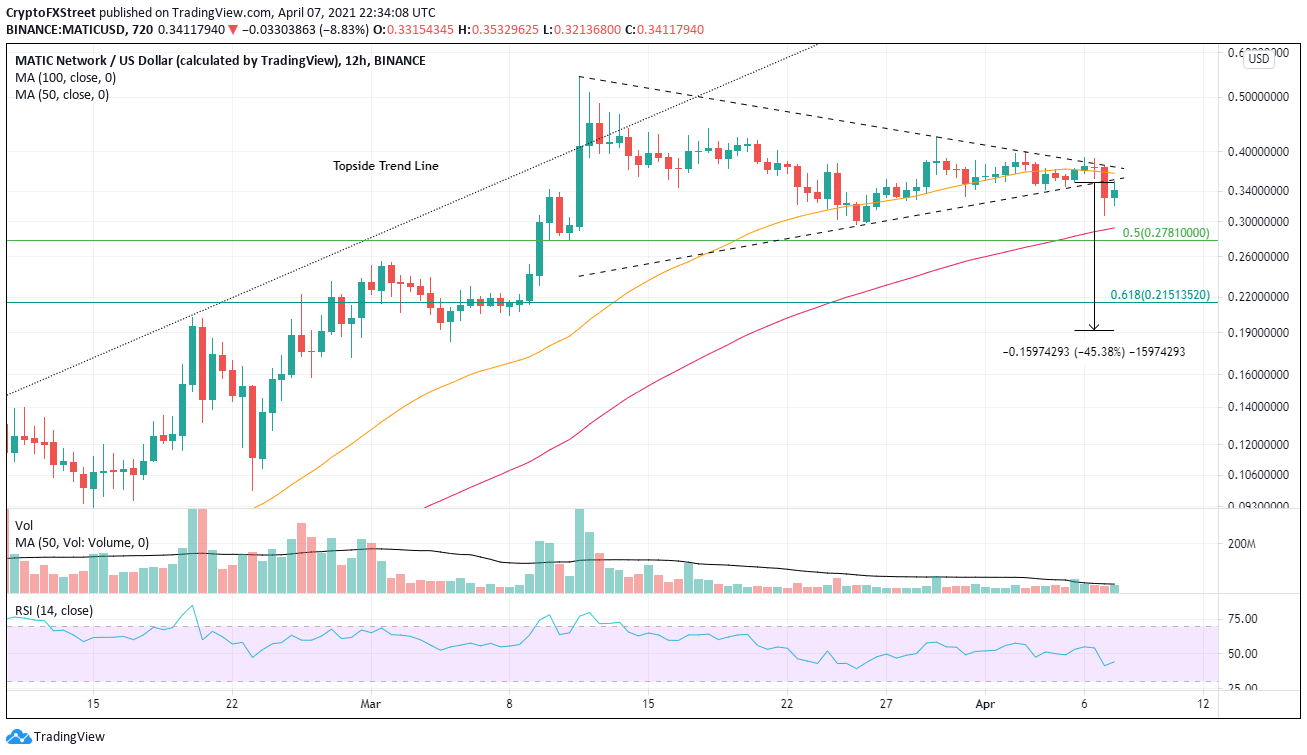
MATIC/USD 12-hour chart
The IntoTheBlock In/Out of the Money Around Price (IOMAP) data expresses a similar bearish tone with out-of-the-money investors currently dwarfing in-the-money investors. There is an open path to the 0.50 retracement level.
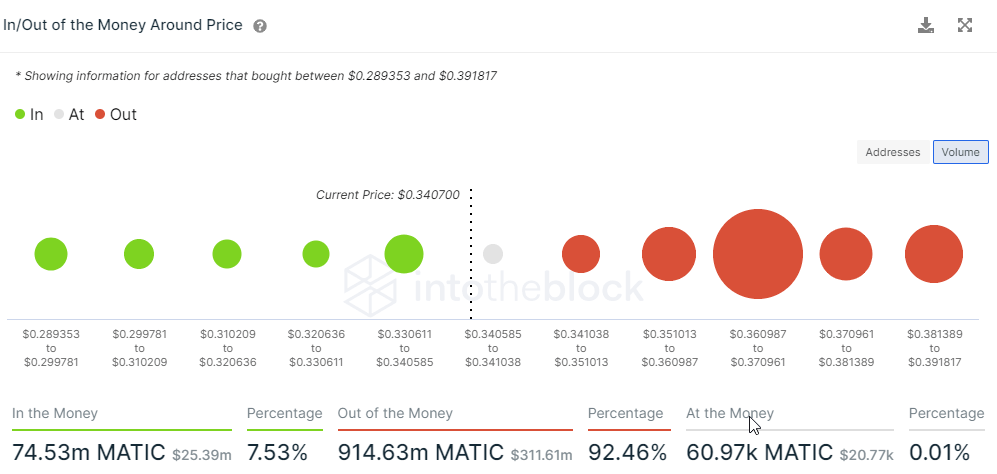
MATIC IOMAP chart
The downward break appears convincing on the 12-hour chart, but shake-outs can occur and quickly reverse to the upside. Bullish sentiment will encounter substantial resistance at the March 29 high at $0.425 and then the all-time high at $0.543. Any further upside would depend on the price/volume profile during the rally.
Author

Sheldon McIntyre, CMT
Independent Analyst
Sheldon has 24 years of investment experience holding various positions in companies based in the United States and Chile. His core competencies include BRIC and G-10 equity markets, swing and position trading and technical analysis.


