MATIC price could be due for a catastrophic crash below $1
- MATIC price is traversing a multi-month rising wedge pattern on a daily time frame, hinting at a 56% crash.
- Long-term on-chain metrics support the theory, while short-term metrics explain the recent upswing.
- A breakdown of the wedge’s lower trend line at $1.76 can trigger a steep nosedive to $0.76.

MATIC price recovery after the December 4 flash crash has been impressive as the bulls are vying to retest the all-time high. Still, the sudden upswing could set the perfect stage for a bull trap.
MATIC price and its rising on-chain activity
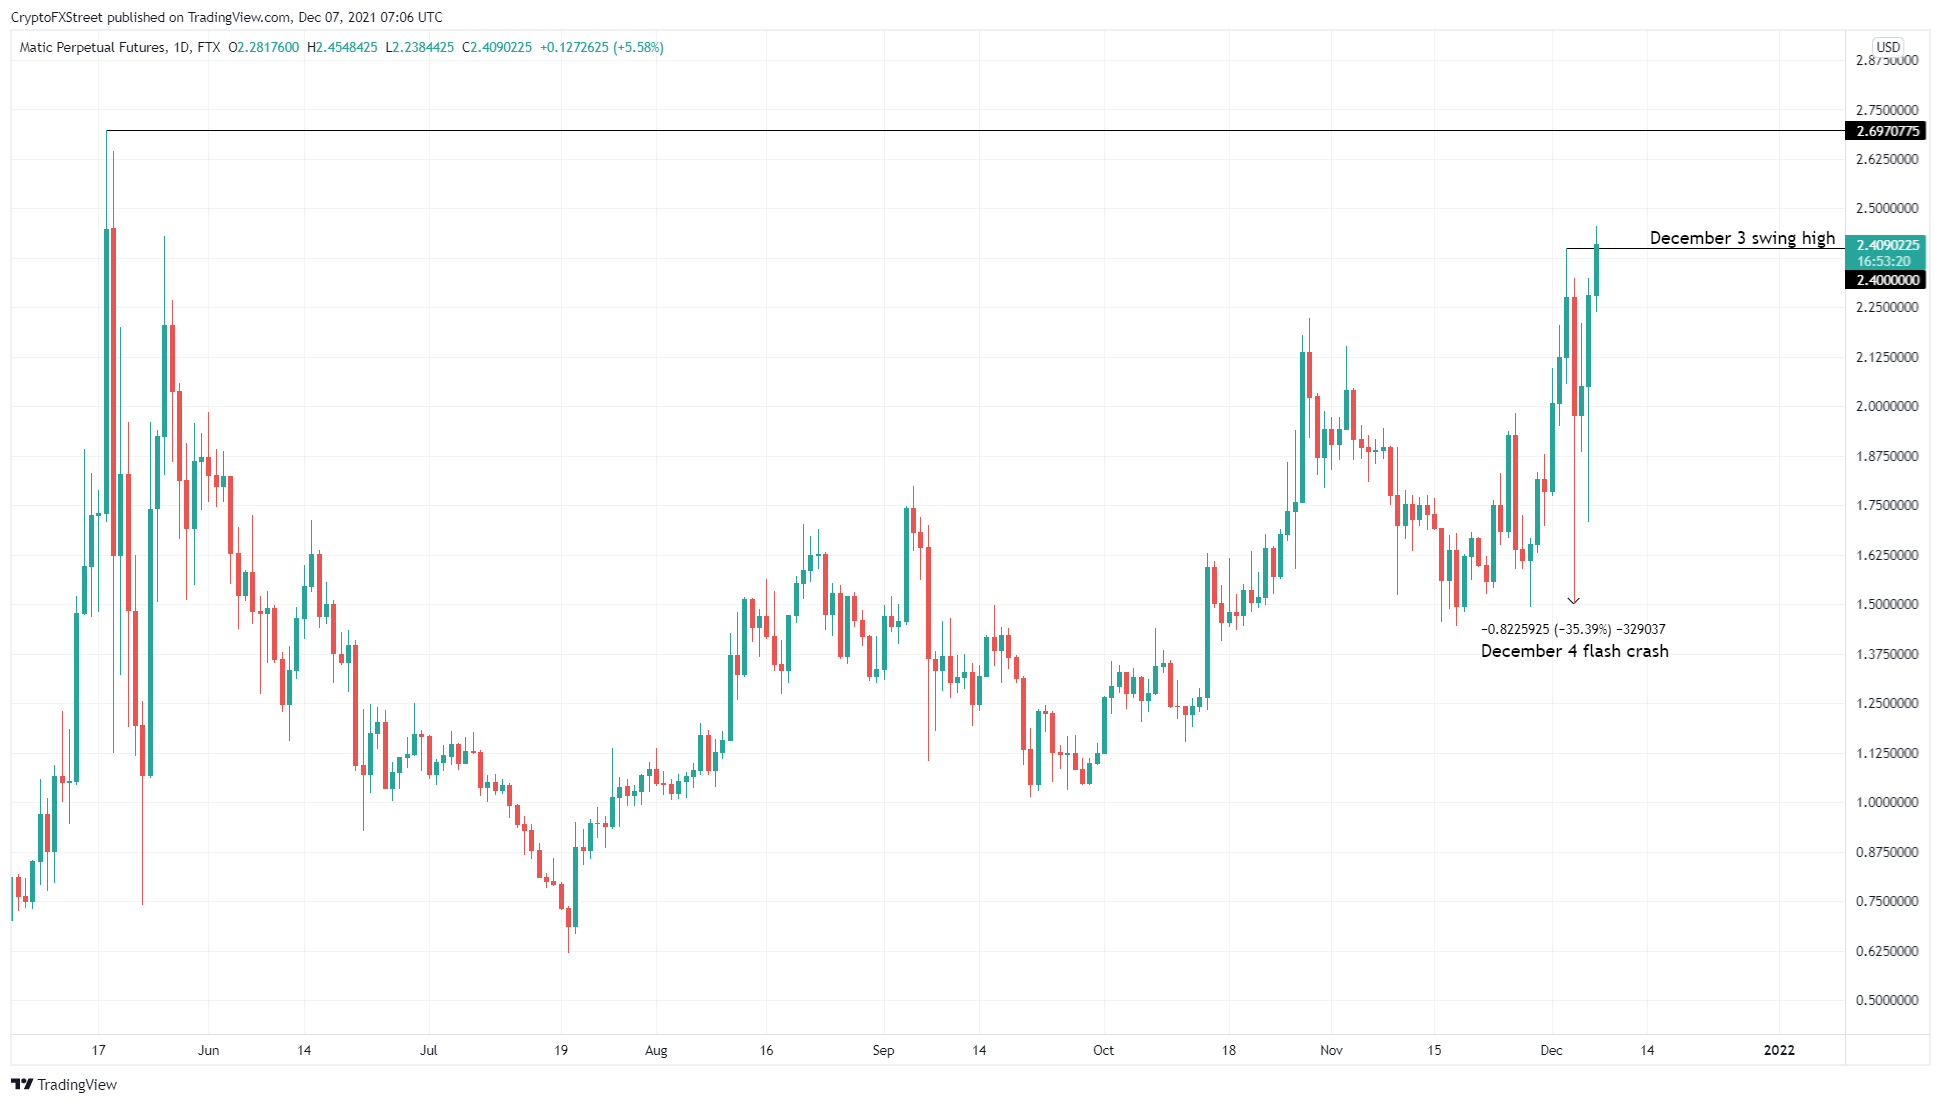
MATIC price experienced a 35% correction on December 4 as the crypto market slid into chaos. Polygon was able to recover 30% of its market value on the same day and has continued to advance further.
While MATIC’s comeback has been remarkable, the price action today pushed the token past the December 3 swing high at $2.4. Such market behavior is indicative of an uptrend extension to retest the all-time high at $2.7.
MATIC/USDT 1-day chart
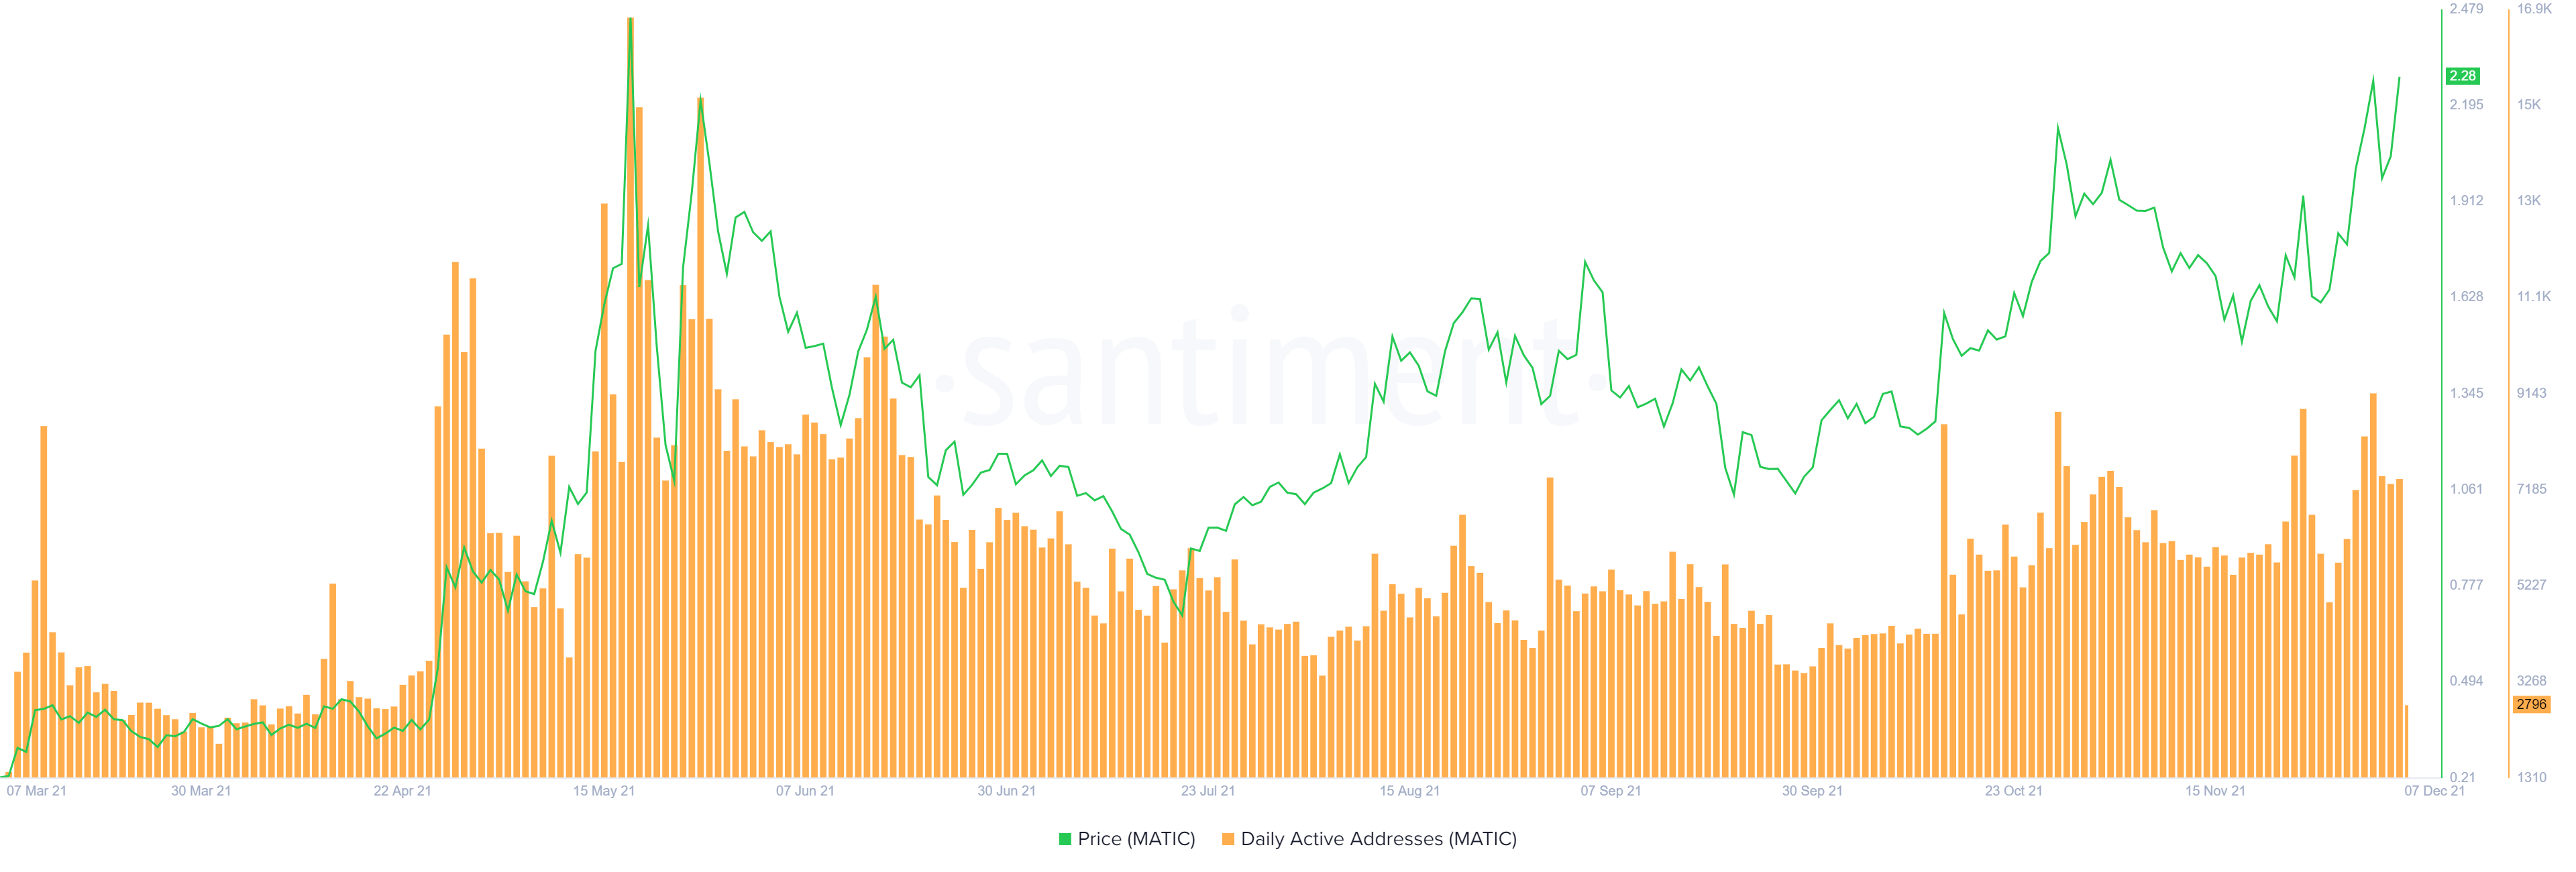
The rising buying pressure coincides with an uptick in daily active addresses (DAA).
The number of DAA on the Polygon network has increased from 4,892 on November 28 to hit a high of 7,406 as of December 6. The 51% increase in network activity suggests that investors are interested in MATIC price at the current levels and are actively interacting with the token.
MATIC DAA
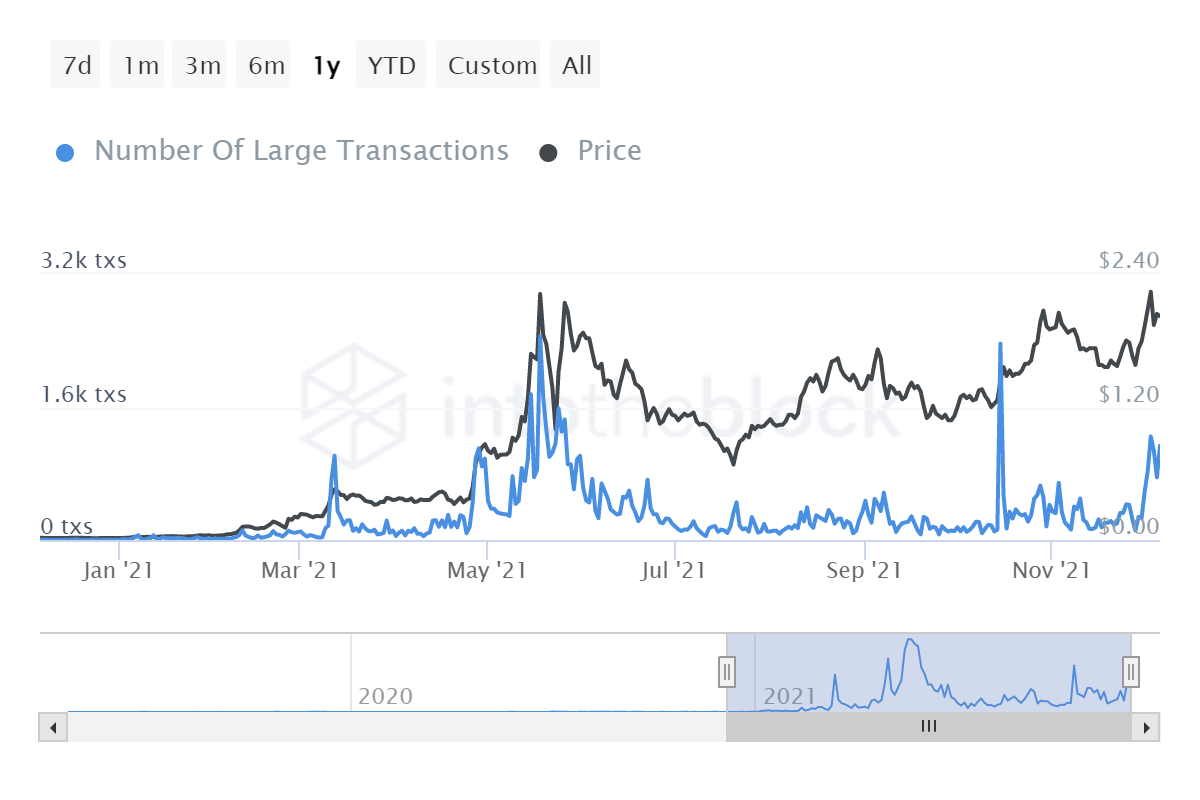
An important spike in the number of large transactions on the Polygon network also adds credence to the optimistic outlook.
Transactions with a value of $100,000 or greater have skyrocketed by a whopping 891%. More than 1,130 large MATIC transactions are taking place today compared to the 114 large transactions recorded on November 27. The uptrend on this on-chain metric can serve as a proxy to whales positioning themselves for higher prices.
MATIC large transactions
Reasons to be skeptical about Polygon
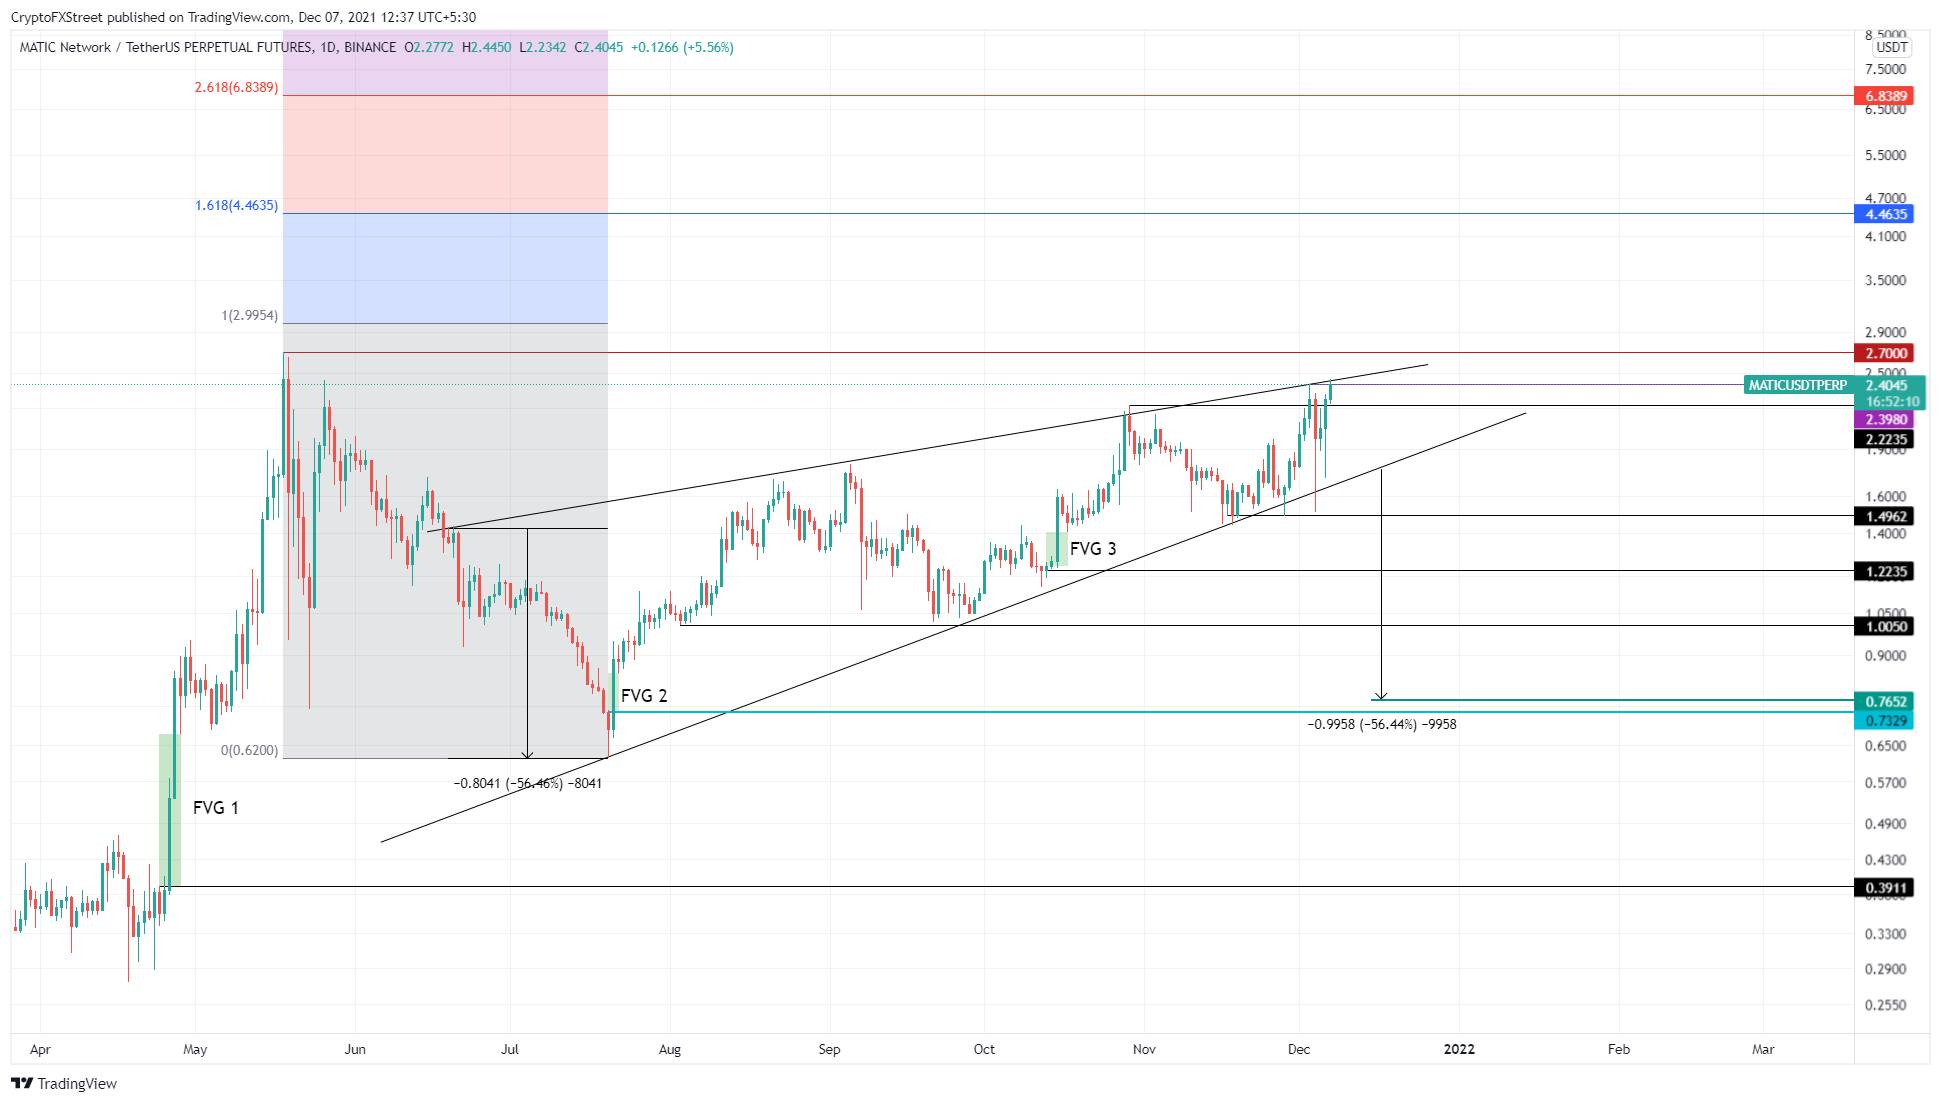
Reason 1: The recent surge in the market value of Polygon is exciting, but investors need to note that the price action since June 20 has resulted in the formation of three higher highs and three higher lows. These points can be connected using trend lines to form a rising wedge.
The technical setup forecasts a 56% correction to $0.76, obtained by adding the distance between the first swing high and low to the breakout point at $1.76. A lower low below the $1.5 support level will validate the bearish thesis and kick off a new downtrend.
For the pessimistic outlook to play out, MATIC price needs to get rejected by the rising wedge’s upper trend line where it currently trades. A breach of resistance level can lead to a retest of the all-time high at $2.7, which might serve to lure uninformed bulls and trap them.
MATIC/USDT 1-day chart
Reason 2: There are three price inefficiencies present below the current price levels and stretch down to $0.39, known as the Fair Value Gap (FVG). These gaps are often filled as market makers push prices down to these levels to collect liquidity.
FVG 3 is the nearest one and ranges from $1.4 to $1.24 and can be accessed after the $1.5 support floor is breached. The second FVG extends from $0.73 to $0.84, which also harbors the theoretical target of the rising wedge formation.
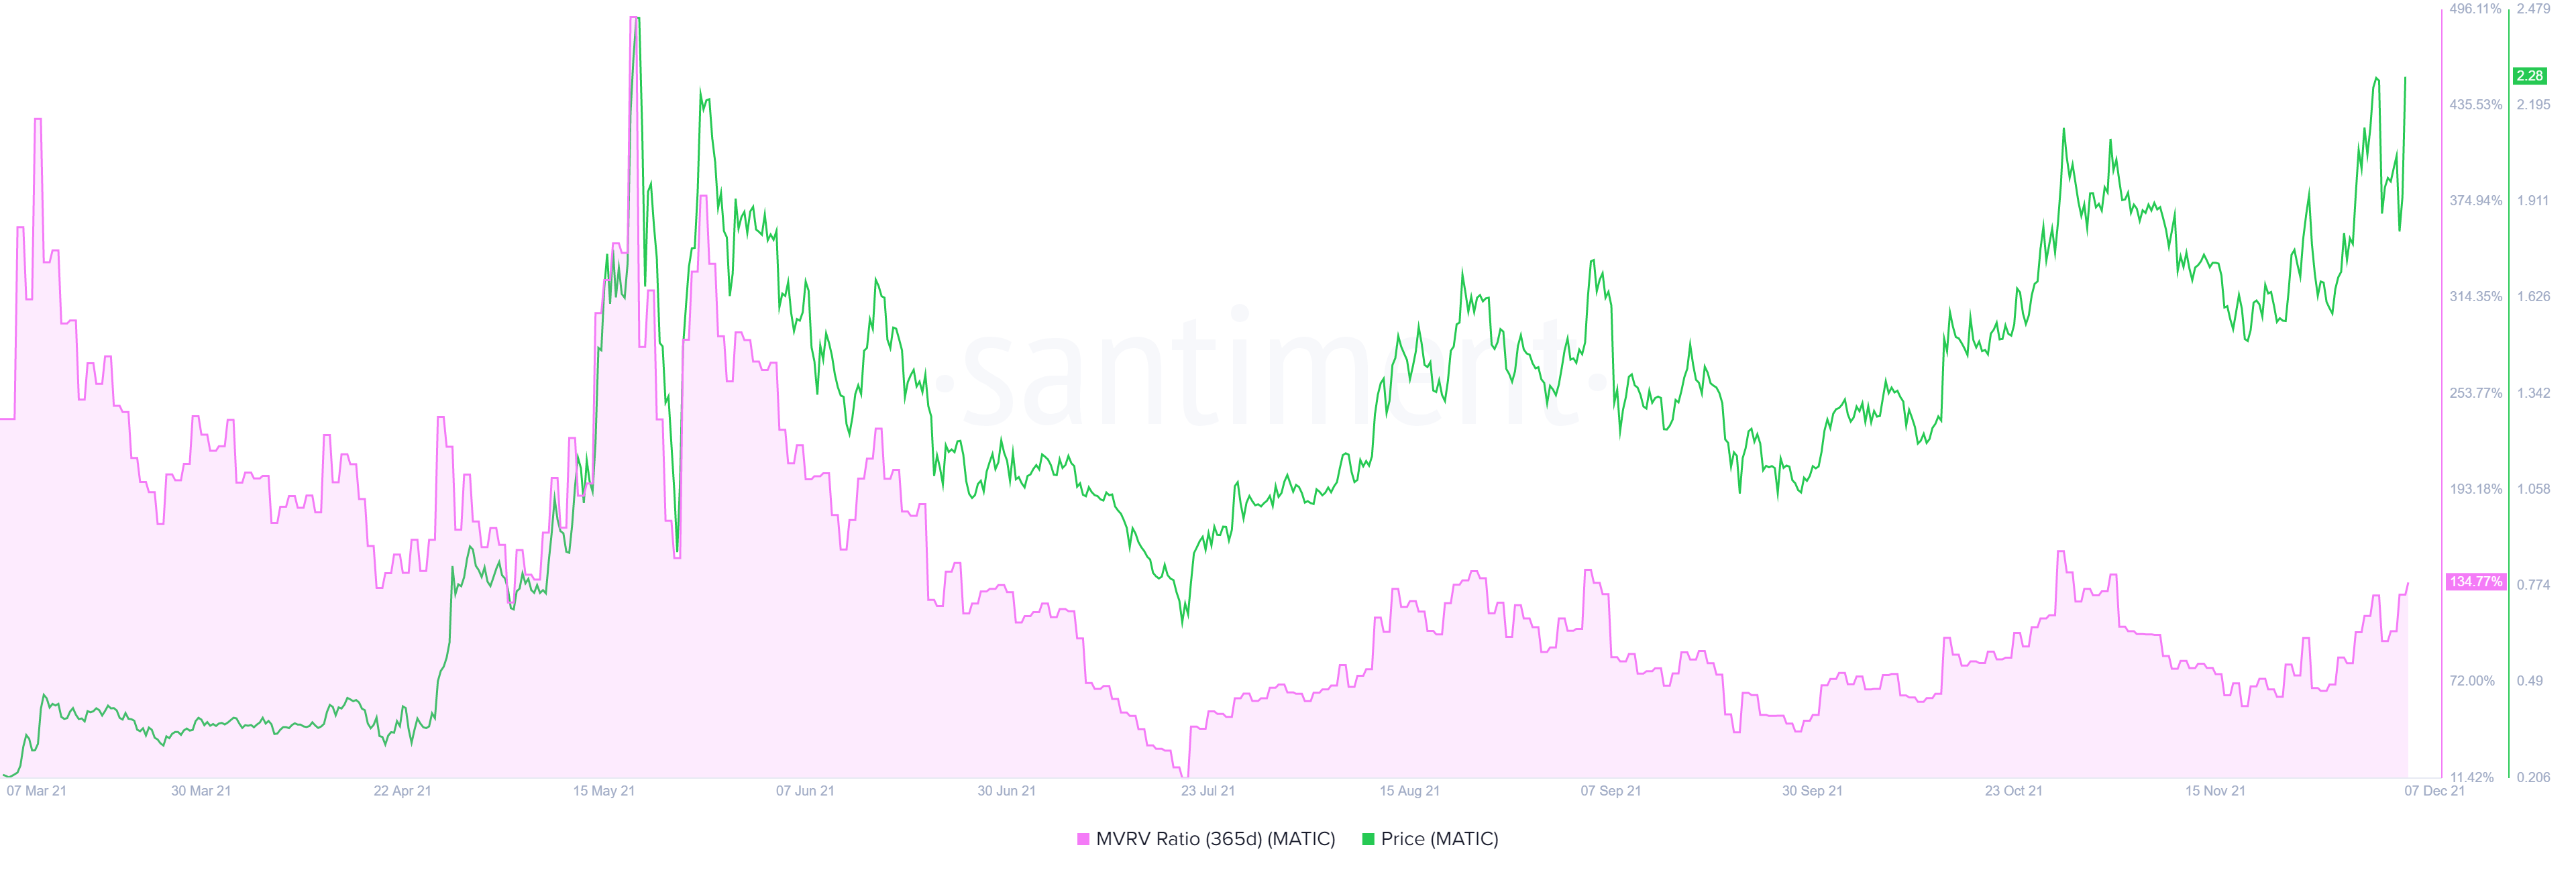
Reason 3: Adding a tailwind to the bearish thesis is Polygon’s 365-day Market Value to Realized Value (MVRV). This on-chain metric is used to determine the average profit/loss of those investors who purchased MATIC over the past year. A high number indicates that a majority of the holders are in profit and are likely to trigger a sell-off if they decide to forgo their investment.
Polygon’s 365-day MVRV currently hovers around 134%. Interestingly enough, the last two times this on-chain metric surpassed the 140% level a steep price correction followed. Similar price action could result in a 40% retracement as it happened in early September and late October.
MATIC 365-day MVRV chart
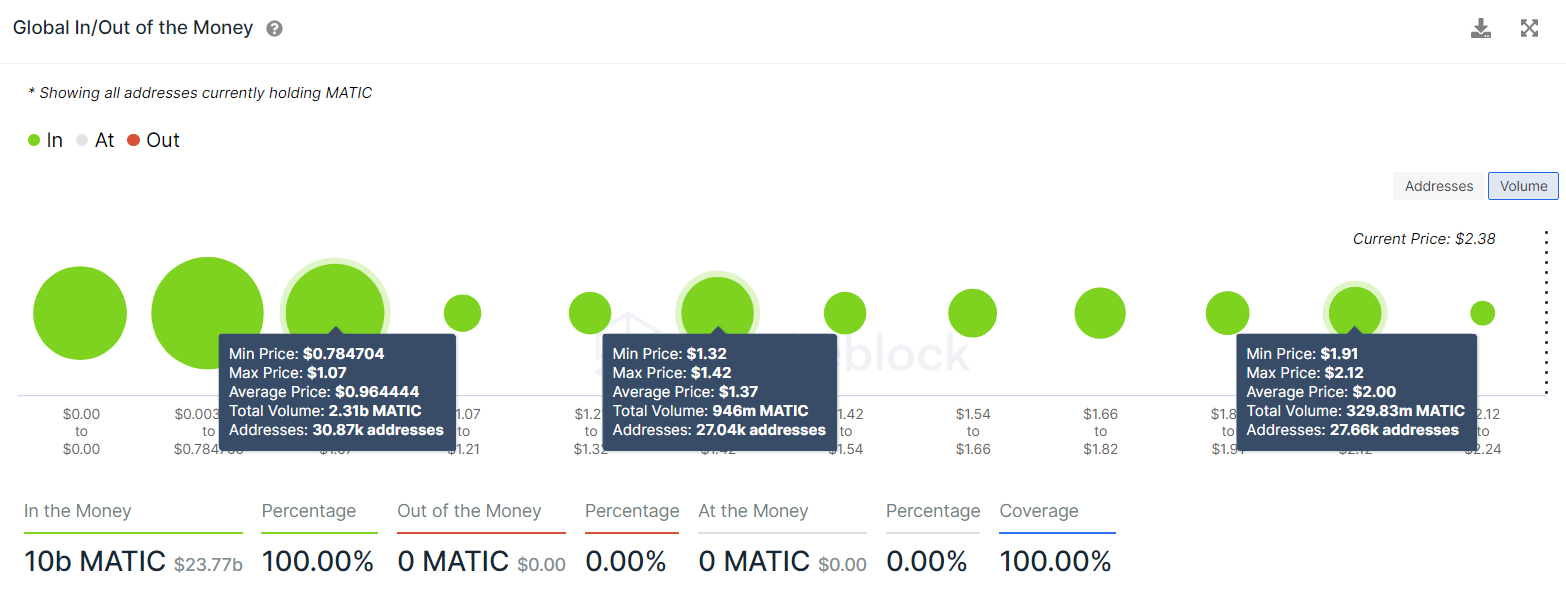
Reason 4: MATIC is fast approaching price discovery or a path of least resistance, where it can swiftly move higher and set up new highs. However, IntoTheBlock’s Global In/Out of the Money (GIOM) model shows that stable support levels are present at $2, $1.37, and $0.96, respectively.
The $0.96 is relatively the strongest level of support and harbors 30,870 addresses that purchased 2.31 billion MATIC. These addresses bought the token in a price range that extends from $0.78 to $1.07, where the theoretical target for the rising wedge is present.
If a massive crash were to occur, sellers would quickly push past the $2 support wall and make their way down to $1.37, where 27,040 addresses purchased 946 million MATIC. Still, a stable support level is only present around the $0.96 level, and that is where investors can expect Polygon price to make a comeback.
As seen in the MATIC/USDT 1-day chart, the $1 psychological level is also vital from a technical perspective; together with the on-chain metrics, this level becomes a point of confluence.
In the event of a Bitcoin crash, market participants can expect MATIC price to revisit the $1. Further selling pressure can result in a wick down to $0.76.
MATIC GIOM
While the bearish outlook is tempting for the long-term holders to accumulate more tokens, it relies heavily on a potential crash for the pioneer cryptocurrency. If Bitcoin price decides to pull a 180 and continues to head higher, the bearish outlook for MATIC price becomes less likely.
Keeping the bull trap thesis in mind, a weekly close above the 100% Fibonacci extension level at roughly $3 will indicate a shift in the trend and invalidate the bearish thesis. If so, market participants can expect MATIC price to make its way to the next level at $4.46.
Author

Akash Girimath
FXStreet
Akash Girimath is a Mechanical Engineer interested in the chaos of the financial markets. Trying to make sense of this convoluted yet fascinating space, he switched his engineering job to become a crypto reporter and analyst.


