Maker Price Prediction: MKR’s utility explodes, kick-starting a massive rally aiming for $700
- Maker cements its position in DeFi as its utility grows as highlighted by on-chain analysis.
- MKR/USD descending wedge pattern breakout aims for $600 after stepping above the 50-day SMA.

Maker is up over 30% in the last seven days and 15% in the previous 24 hours. The token is the second-largest in terms of value locked in the decentralized finance (DeFi) ecosystem. At the moment, Maker boasts of $1.9 billion in total value locked. It comes second after UniSwap, with $2.2 billion. Meanwhile, Maker is doddering at $588 amid a bullish building momentum. The biggest question is, does Maker have what it takes to continue going up?
Maker’s surging utility
Maker has, from the onset, presented itself as the epitome of decentralization, especially in the DeFi sector. The token has taken advantage of the new ecosystem's craze to be a leader like Bitcoin and not a follower. Investors have the opportunity to lock their MKR tokens and earn interest or borrow collateralized loans. As the total value of funds locked in MKR skyrockets, so does its utility. For instance, the value locked grew from slightly below $200 million at the beginning of 2020 to $1.9 billion.
Santiment, a global leader in on-chain metrics, says that the growth is also reflected in the token’s network activity. According to Santiment, Maker “has the largest bullish divergence between daily active addresses and current price (based on historical means) of any top 100 blockchains.”
People mostly sleeping on $MKR while utility goes through the roof, and conversations abound around its value capture model. pic.twitter.com/orCqp50RiP
— Chris Burniske (@cburniske) September 30, 2020
Maker’s bullish outlook eyes $700
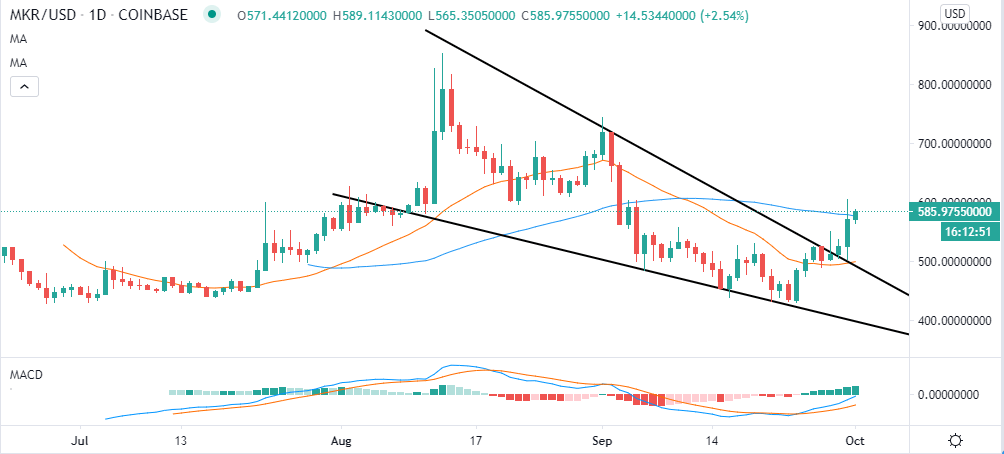
The DeFi token is in the middle of a bullish momentum following a breakout from a descending wedge pattern. Before the reversal, Maker suffered a blow after hitting August's high at $850. The downtrend was unstoppable until MKR embraced support at $430.
The breakout above the wedge pattern has sent Maker above the 50-day Moving Average. A daily close above this crucial indicator would pave the way for gains past $600. Meanwhile, the Relative Strength Index (RSI) is heading in the direction of the overbought. The gradual recovery from levels above 30 highlights the firm bullish grip.
MKR/USD daily chart
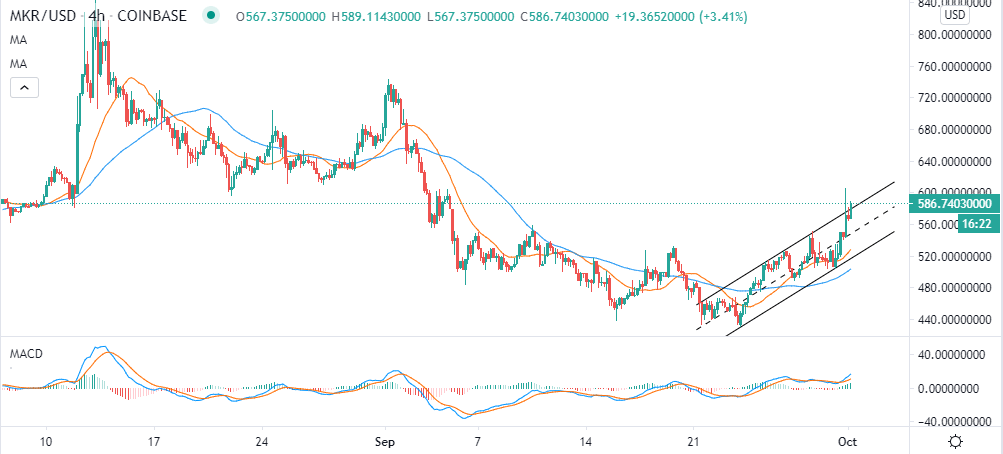
The 4-hour chart shows MKR attempting to break out of an ascending parallel channel. If the breakout materializes and Maker steps above $600, then the focus will shift to $640 and $700 resistances, respectively. The ongoing uptrend is highlighted by the Moving Average Convergence Divergence (MACD) as it moves higher within the positive region. A bullish divergence from the MACD cements the bulls’ presence in the market.
MKR/USD 4-hour chart
IntoTheBlock’s “Daily Active Addresses” metric reveals a surge in the new addresses joining the network and the active addresses. The new addresses joining the Maker network surged from approximately 130 on September 27 to about 560 on October 1. Similarly, there was an increase in the active addresses from nearly 400 to roughly 970. The surge in these metrics also corresponded with the rise in the price from $508 to $588 (prevailing MKR market value). It also shows that Maker is a stable network and with the influx of funds, its value is bound to continue growing.
Maker daily active addresses chart
-637371383668612006.png)
The surge in the daily active addresses coincided with a spike in the exchange inflow, which tends to precede a spike in the price. However, the exchange inflow has gone down significantly over the last 24 hours according to Santiment, from a monthly peak of about 2,400 MKR to roughly 140 on October 1. The decline suggests that Maker could lack the volume to support an uptrend in the near term.
Maker exchange inflow
 exchange inflow-637371384433153271.png)
Consequently, it's essential to realize that whales are beginning to add to the market's selling pressure. Santiment’s holder distribution metric shows that addresses holding between 1,000 and 10,000 MKR have tanked from 83 on September 25 to 78 on October 1. On the other hand, this selling pressure could be absorbed by the addresses holding between 10,000 and 1 million MKR, after increasing from 10 to 13 in the last 24 hours.
Maker holder distribution chart
 holder distribution-637371385243127443.png)
Looking at the other side of the picture
Maker is currently in the hands of the bulls. However, if the price fails to close above the 50-day SMA, losses could come into the picture. The exchange inflow decrease means that Maker might not have the volume to keep the rally going. Simultaneously, some whales have started to sell, probably anticipating bottlenecks in the rally from now on. The downside support is established at the 21-day SMA ($500) and $430, respectively.
Author

John Isige
FXStreet
John Isige is a seasoned cryptocurrency journalist and markets analyst committed to delivering high-quality, actionable insights tailored to traders, investors, and crypto enthusiasts. He enjoys deep dives into emerging Web3 tren


