MAGA Price Forecast: Poised for 27% crash
- MAGA price breaks below the ascending trendline, a bearish sign.
- Technical analysis indicates weakness in TRUMP’s momentum indicators.
- A daily candlestick close above $14.12 would invalidate the bearish thesis.

MAGA (TRUMP) price, a meme coin inspired by former US President Donald Trump and his “Make America Great Again”, broke below the ascending trendline on Saturday, signaling a bearish trend shift as the candidate gathered with supporters in Detroit in a bid to lure voters in the key swing state of Michigan. Technical indicators signal exhaustion in bullish momentum for the meme coin, opening the door for bears to push down TRUMP’s price by 27%.
TRUMP price looks set for correction
MAGA price (TRUMP) broke below the ascending trendline on Saturday, drawn from joining multiple swing low points from May to June, as shown in the 12-hour chart.
TRUMP price retested the breakout of the ascending trendline on Sunday, but failed to recover its position above it and posts significant losses on Monday.
If this resistance level holds, then MAGA price could crash 27% from the breakout level around $13 to its 61.8% Fibonacci retracement level at $9.21, drawn from a swing low of $3.92 on May 8 to a swing high of $17.76 on June 1.
The Relative Strength Index (RSI) and the Awesome Oscillator (AO) on the 12-hour chart support this bearish outlook by both being below their respective mean levels of 50 and 0, indicating that bears still have steam to push TRUMP's price lower.
If the bears are aggressive and the overall crypto-market outlook is negative, then MAGA’s price could break below $9.21, and extend the decline by an additional 29% to retest its daily support of $6.57.
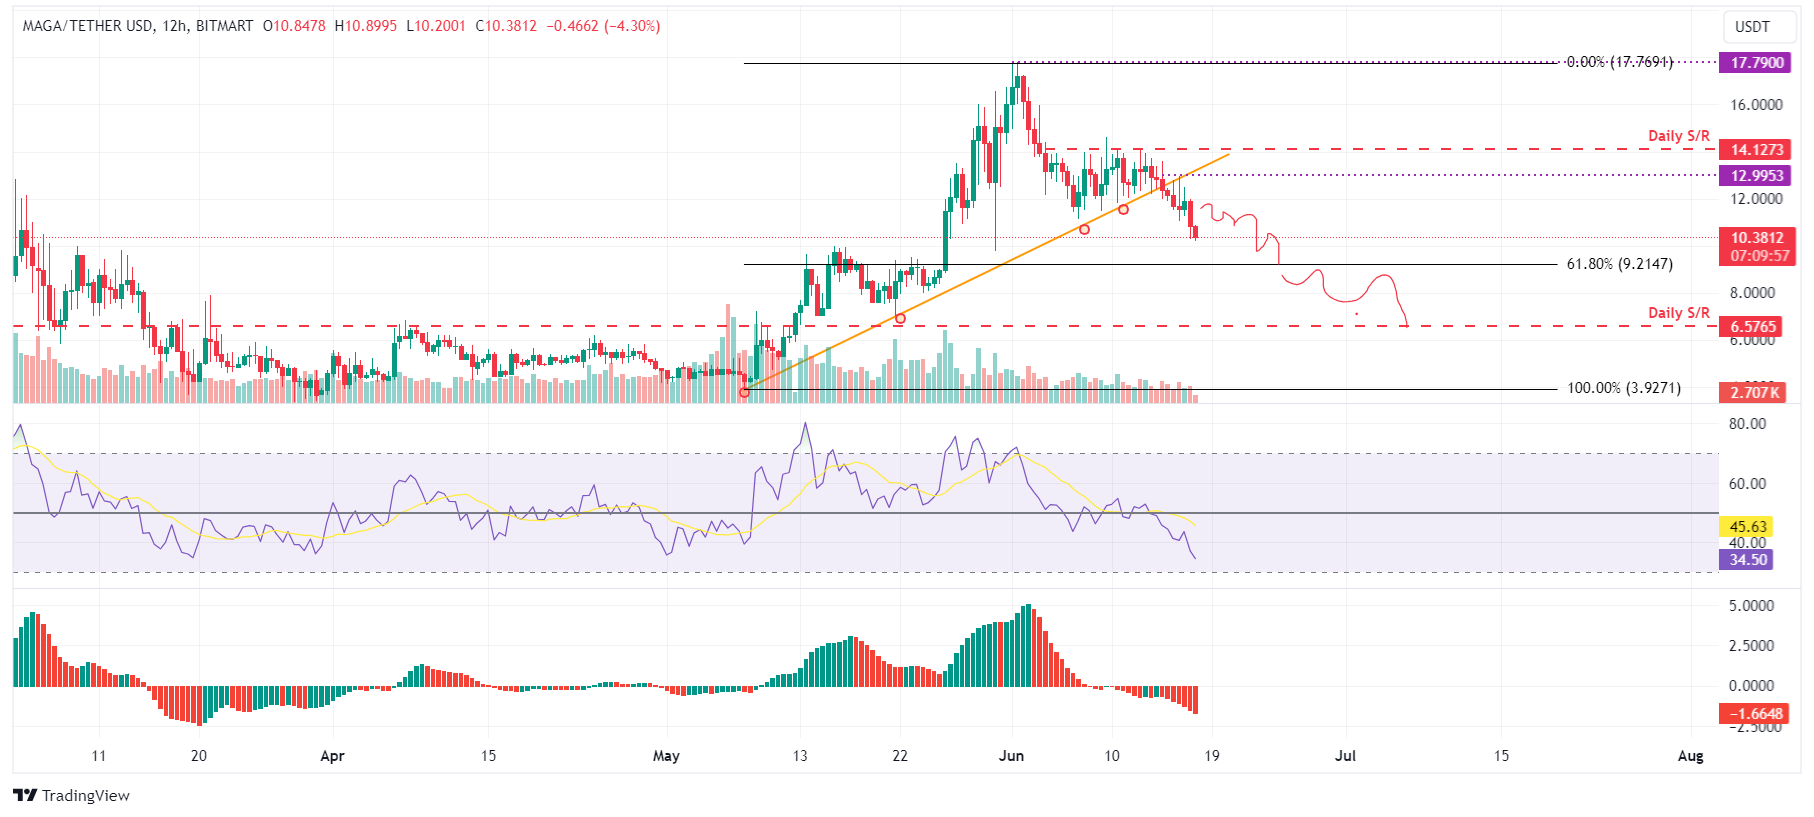
TRUMP/USDT 12-hour chart
However, if the TRUMP daily candlestick closes above $14.12, it will produce a higher high in the daily time frame, suggesting that the recent dip was short-lived. This change in market structure would invalidate the bearish thesis and catalyze a 26% increase in the MAGA price to revisit its daily high of $17.76 from June 1.
This optimistic price scenario may also find support from a Reuters-Ipsos poll conducted post-verdict on May 30. Despite Trump's conviction on 34 felony counts related to falsifying business records, only 10% of registered Republicans indicated they were less likely to vote for him. In contrast, 56% stated the verdict would have no impact on their voting decision, and 35% even suggested it would increase their likelihood of supporting Trump.
Author

Manish Chhetri
FXStreet
Manish Chhetri is a crypto specialist with over four years of experience in the cryptocurrency industry.




