Litecoin price resistance at $186 dictates the future of an LTC rebound
- Litecoin price continues to illustrate a symmetrical triangle, edging closer to the apex of the pattern.
- Potential LTC rally threatened by the strategically important 200-day simple moving average (SMA).
- Low volume endures, offering no insight into the accumulation-distribution profile of the cryptocurrency.

Litecoin price action has been dull since the May 23 low as the area around the 200-day SMA has been a tremendous influence. Unless LTC overcomes the significant resistance constructed by the moving average and the symmetrical triangle’s upper trend line, the digital asset outlook will remain neutral with a bearish bias.
Litecoin price strikes some support, but commitment may be temporary
Litecoin price plummeted 70% from the May 10 high of $413.91 to the May 23 low of $117.58, including a 36% decline on May 19 and a 50% decline for that volatile week. The daily decline was one of the largest going back to 2017, and the weekly loss was by far the largest, taking the daily Relative Strength Index (RSI) to an oversold reading for the first time since March 2020.
Litecoin price action since the May 23 low has been uneventful, offering few opportunities for LTC swing traders. However, the resulting symmetrical triangle dictated by the narrowing price range is inching closer to the pattern’s apex, signaling that the eventual resolution will likely not be carried by impulsiveness or achieve percentage significance.
The measured move for the symmetrical triangle is approximately 47%. An upside resolution of the pattern could carry Litecoin price to the 50% retracement of the May correction at $265.75 and the lower boundary of a previously important ascending channel. Conversely, a bearish resolution would knock LTC down to $83.70, well below the 200-week SMA at $95.00.
For the keen LTC investor, Litecoin price needs to capture a daily close above the triangle’s upper trend line at $180.60 and the imposing 200-day SMA at $185.73. If achieved, the token is free to test the 38.2% Fibonacci retracement of the May collapse at $230.78 and potentially the 50-day SMA at $237.54. A rally of that stature would offer a 30% profit to investors.
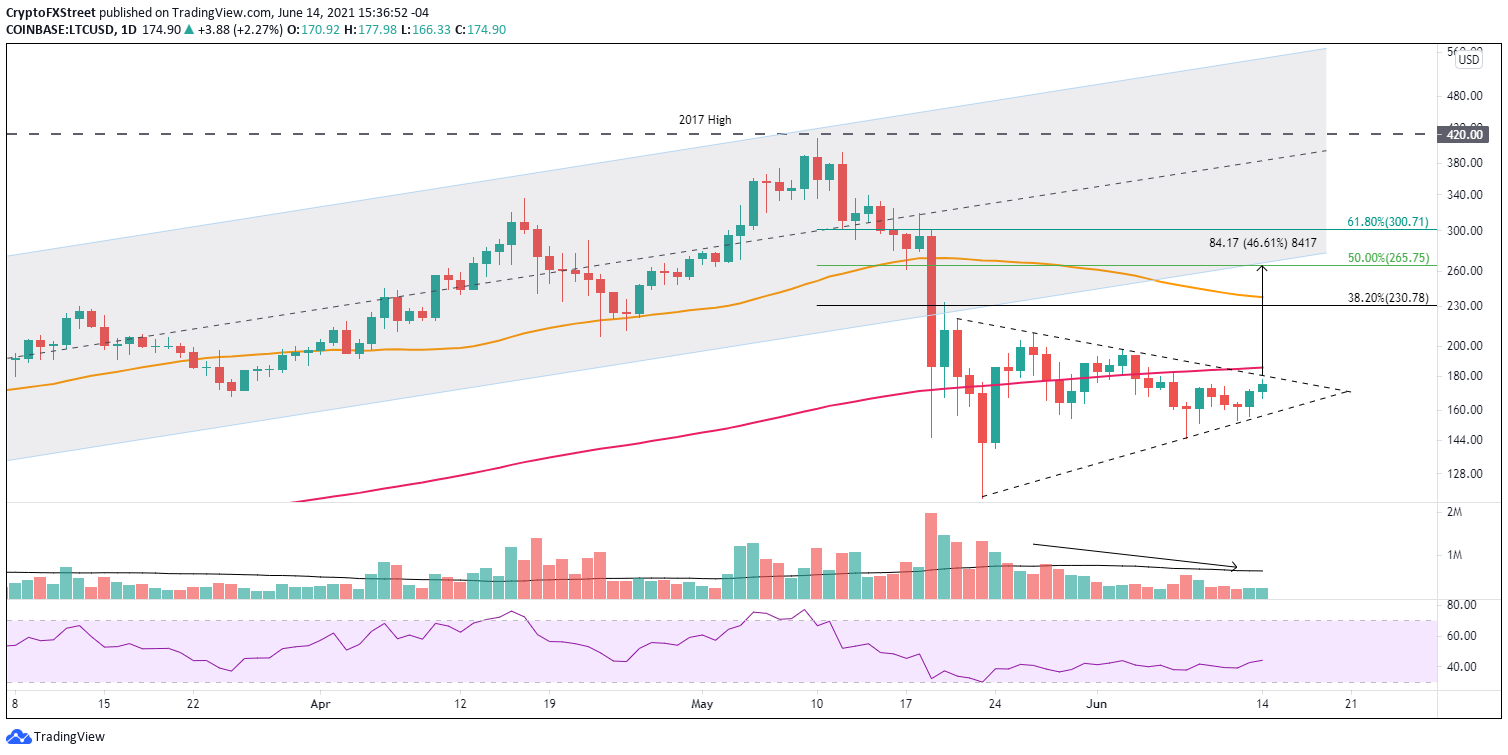
LTC/USD daily chart
A close below the lower trend line puts Litecoin price on pace to sweep below the June 8 low of $145.00, and if the market deteriorates, a test of the May 23 low of $117.58, thereby delivering a 25% loss for LTC investors.
Litecoin is the 11th largest cryptocurrency by market capitalization. Still, a cursory review of a Google Search shows limited coverage, which may explain the uneventful LTC price action over the last few weeks. Like Chainlink, LTC investors would benefit from being patient and letting the cryptocurrency close above the earlier mentioned levels. There is no rush to own it today, particularly when the outlook has a bearish bias.
Author

Sheldon McIntyre, CMT
Independent Analyst
Sheldon has 24 years of investment experience holding various positions in companies based in the United States and Chile. His core competencies include BRIC and G-10 equity markets, swing and position trading and technical analysis.


