Litecoin price recovery in jeopardy as LTC buyers show little intention of overcoming resistance
- Litecoin price is stuck below the 50 twelve-hour SMA as the buyers seem unmotivated in lifting prices higher.
- LTC would discover meaningful support at $168 should the altcoin continue to lose momentum.
- Litecoin could see an 11% drop toward the demand zone if LTC fails to slice above a key resistance level.

Litecoin price erased most of its gains over the past week as the recent market-wide crash witnessed LTC plunge by 27%. Although the altcoin has recovered by over 11% since its swing low, there is little room to move toward the upside as buyers seem uninterested in reversing the period of underperformance.
Litecoin price struggles with reversing downtrend
Litecoin price has seen a bounce from the September 7 low, but a reversal of the downtrend could be tough. On the 12-hour chart, LTC is attempting to tag the 50 twelve-hour Simple Moving Average (SMA) coinciding with the 61.8% Fibonacci retracement level at $183. However, this level currently acts as stiff resistance as trading volume has diminished.
Given the lowered trading volume and decreased buying pressure, Litecoin price would find it challenging to tackle the aforementioned obstacle. In addition, the Arms Index (TRIN), which gauges the overall market sentiment, suggests that there are currently more sellers than buyers, adding credence to the bearish outlook.
The first line of defense for Litecoin price is at $176, but further selling pressure may push LTC lower to tag the 50% Fibonacci retracement level. This area may act as meaningful support for the altcoin, as the support line given by the Momentum Reversal Indicator (MRI) also suggests that buyers may step in at this level.
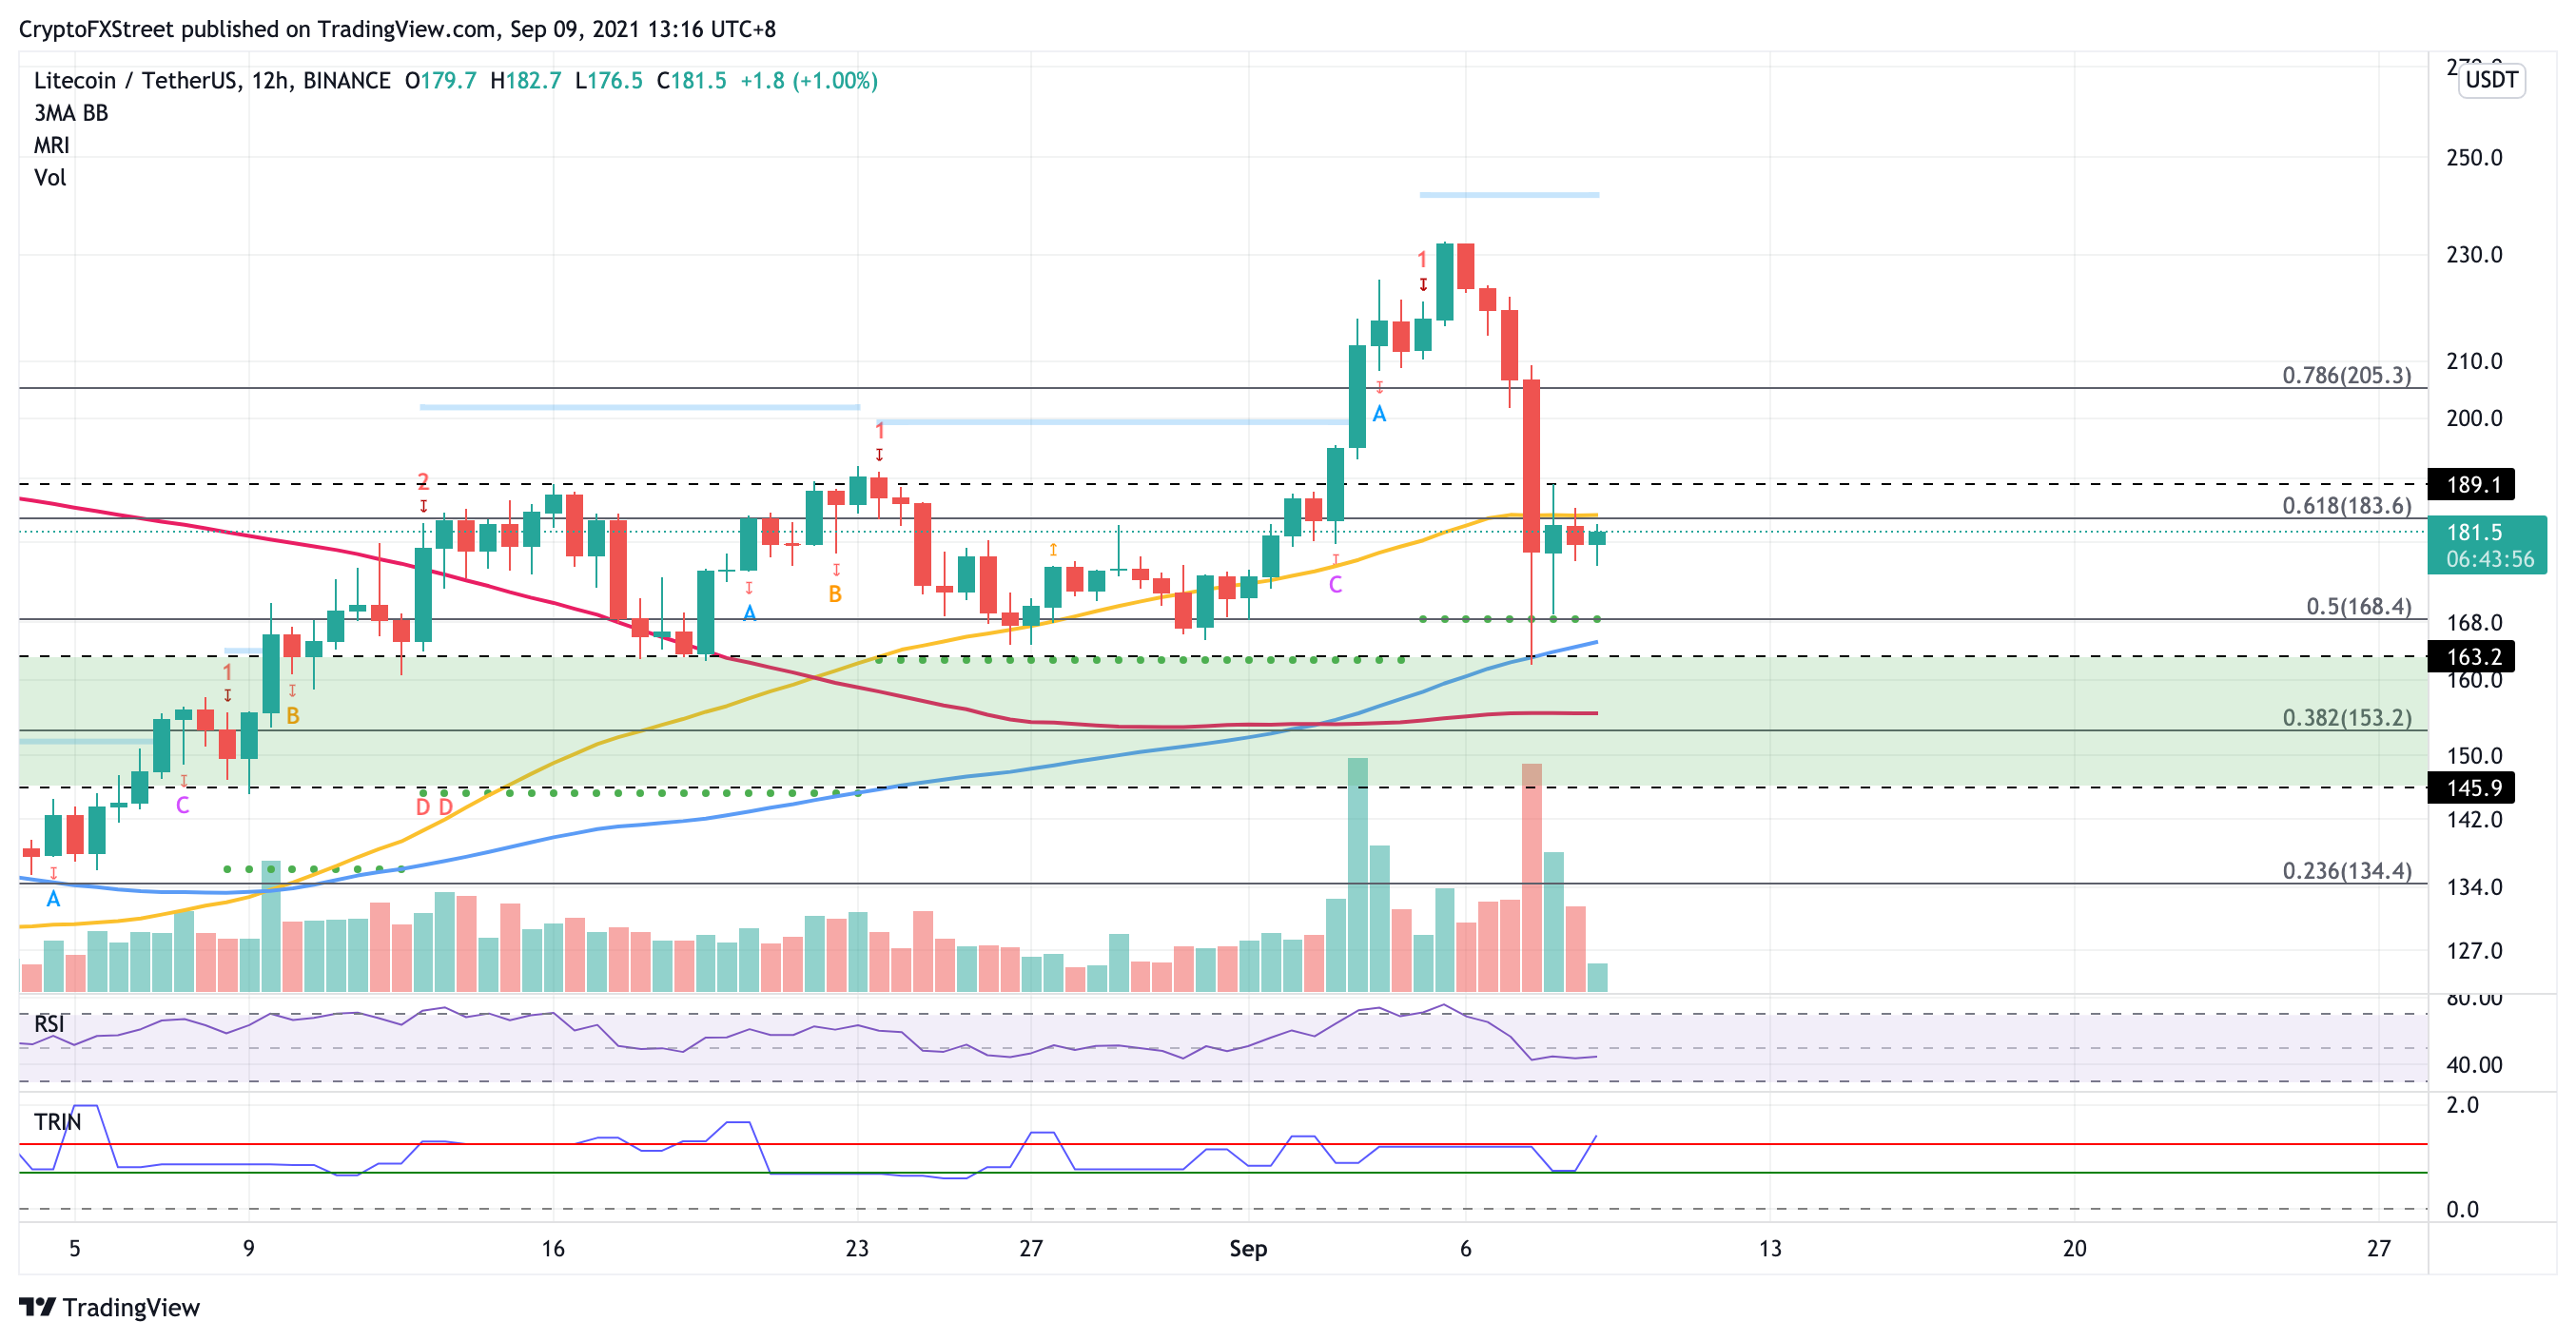
LTC/USDT 12-hour chart
However, should Litecoin price see further collapse, LTC could reach the 100 twelve-hour SMA that sits at $165 before entering the demand zone that stretches from $163 to $145. Lower levels are not expected in the near term unless another catastrophic event materializes.
Moving forward, the bulls would need to slice above the 50 twelve-hour SMA at $183 to resume recovery for Litecoin price. To open up opportunities for additional upside moves, LTC must also overcome the following hurdle at $189 for an uptrend to be confirmed.
Should the bulls come back into power, accompanied with accelerated interest, Litecoin price may then aim for the 78.6% Fibonacci retracement at $205 before attempting to retest the swing high at $232.
Author

Sarah Tran
Independent Analyst
Sarah has closely followed the growth of blockchain technology and its adoption since 2016.



