Litecoin back to the drawing board as LTC rally culminates
- Litecoin has dipped lower after two failed attempts to take over the 200-day Simple Moving Average.
- Sellers have taken over from the buyers, and price action is descending further down.
- A return to the bandwidth between $135 and $156 looks like the sanest move to attract buyers again.

On August 16 and again on August 23, Litecoin (LTC) tried to reach the 200-day Simple Moving Average (SMA). Both tests failed and what followed each time was a quick reversal. After August 16, the green ascending trend line, originating from July 21, could provide enough support for buyers to stay in the rally and build up momentum for a second attempt.
With the backbone gone, the price will drop like a pudding
The second attempt on the 200-day SMA, hovering around $193, failed again, but this time the rejection after that was so heavy that it broke the green ascending trend line. With the backbone of the rally broken, sellers eagerly saw their awaited queue to step in and start selling. Buyers reattempted to reclaim but got rejected to the downside against that green ascending trend line and the monthly R2 resistance level at $181.56.
The general sentiment is not helping either, with most major cryptocurrencies in the red and global markets in a very nervous place.
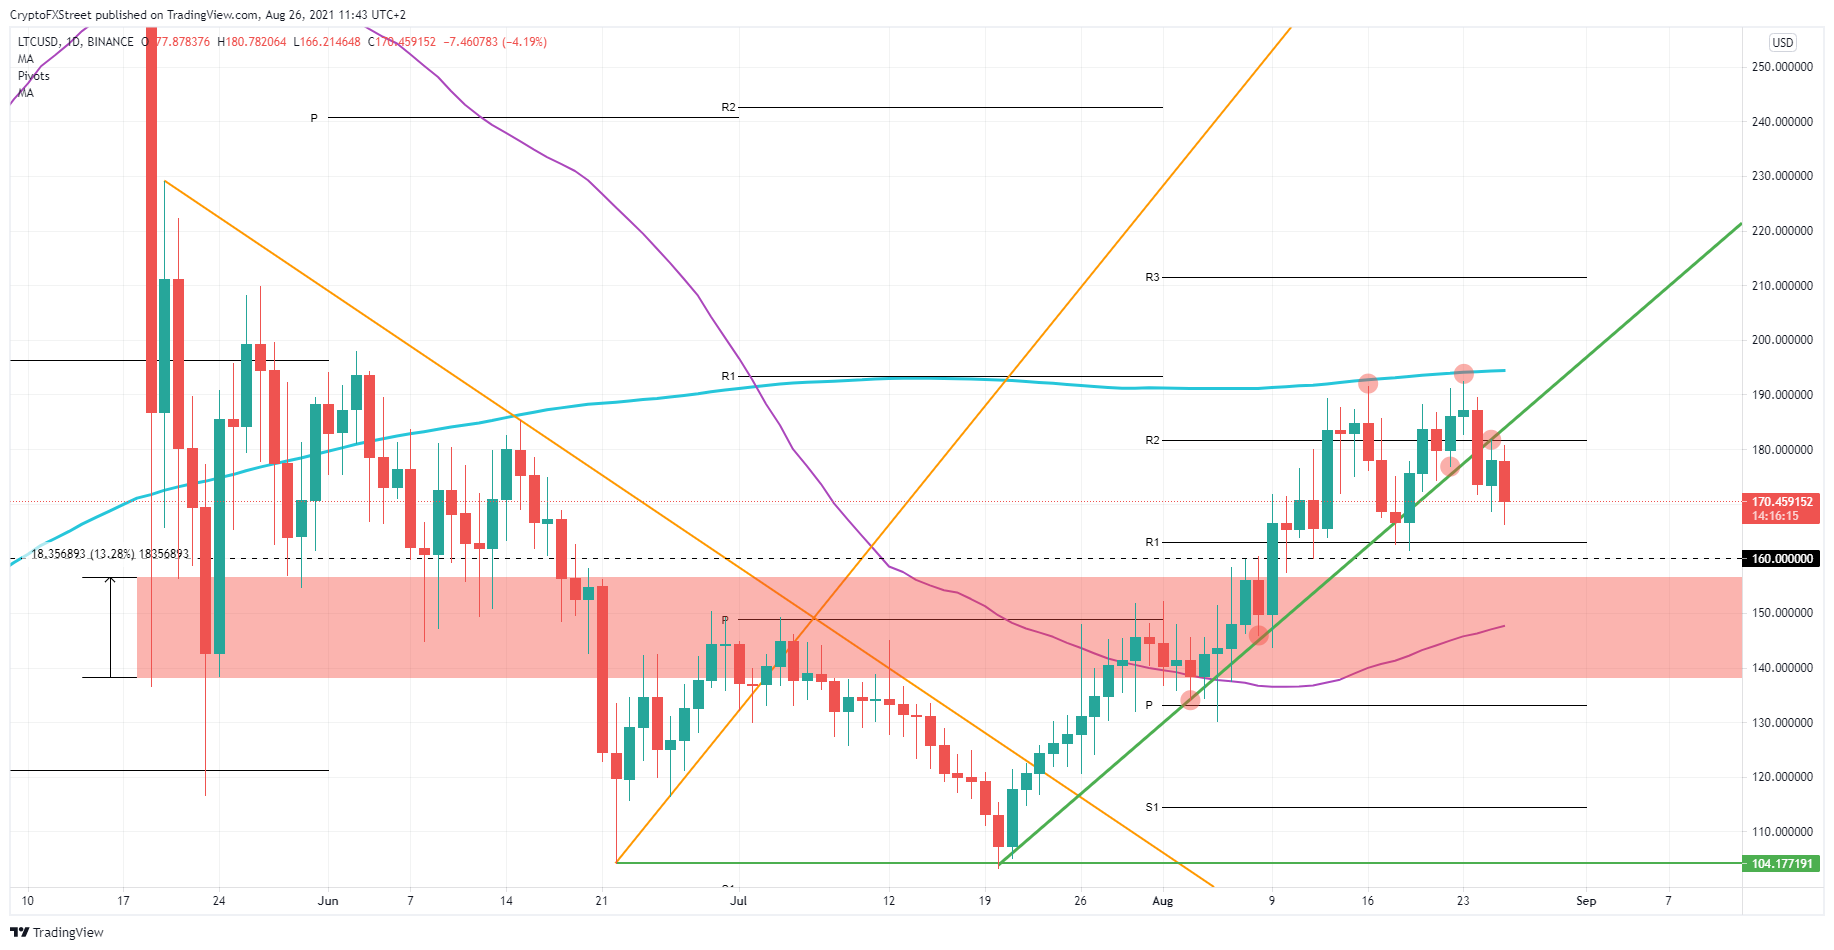
LTC/USD daily chart
LTC is looking for support that might be found short-term at $163. That level falls in line with the monthly R1 Resistance, although that level has been chopped up already quite a lot in the past few weeks. Expect a further run downwards toward $160.
That level might be a key one for short-sellers to take profit. Buyers can already step in here and even make it a fade-in trade. Once below $160, expect to dip in that red band region between $138 and$156. This region will act again as a distribution zone where buyers and sellers will hand over the position, so buyers should be able here to reclaim. Add the 55-daily SMA in as an additional factor, and then expect a run-up again to $180 once this correction is behind for Litecoin.
Author

Filip Lagaart
FXStreet
Filip Lagaart is a former sales/trader with over 15 years of financial markets expertise under its belt.


