• Litecoin price rose by 35% in January.
  • LTC shows potential to rally toward the $120 liquidity zone.
  • The uptrend potential depends on the $87 swing point remaining unbreached.

Litecoin price appears unfazed by the resistance formed above Bitcoin’s trillion-dollar market cap. Market makers may be eyeing the surplus liquidity resting in the mid-$120 zone.=

Litecoin price stair steps higher

Litecoin price has displayed strong uptrend behavior in recent days. In January, the bulls returned nearly 40% of the lost value to loyal investors. The uptrend shows all the signs that the gains can continue. While many in the crypto space are in disbelief due to the rapid change of market behavior displayed by all cryptocurrencies since January 1, the Litecoin price shows potential to rally an additional 20% from the current market value. 

Litecoin price currently auctions at $94.53. The recent uptrend move has displayed a significant amount of turbulence, which justifies the indecisive sentiment held by traders in the market. For instance, the largest candle within the rally still belongs to the bears, which occurred on November 8, when LTC fell by 15% from $67 to $57 in one day. 

During the recent 40% upswing, the largest green candle only displays an 8% gain at most, which occurred on Friday, January 20, when the Litecoin price rose from $83 to $90. Gauging the largest candlestick within an overall trend is a classical technical analysis technique used to decide who is a control of the larger narrative.

The Relative Strength Index (RSI), an indicator used to gauge the trend's underlying strength, shows short-term optimistic signals.  During the rally, the RSI breached overbought conditions and consolidates above the previous resistance zone. Because Litecoin has persistently established a new high every few days since January 1 without producing a lower low, the uptrend is still intact.

The bulls are likely aiming for the upper boundary of a descending trend channel that has impacted Litecoin's price action since early 2021. The liquidity above the barrier has remained unchallenged since 2022, when LTC fell 60% from $120 to the $40 lows. The bullish scenario creates a potential 27% increase in market value from the Litecoin current price.

ltc/2/1/23

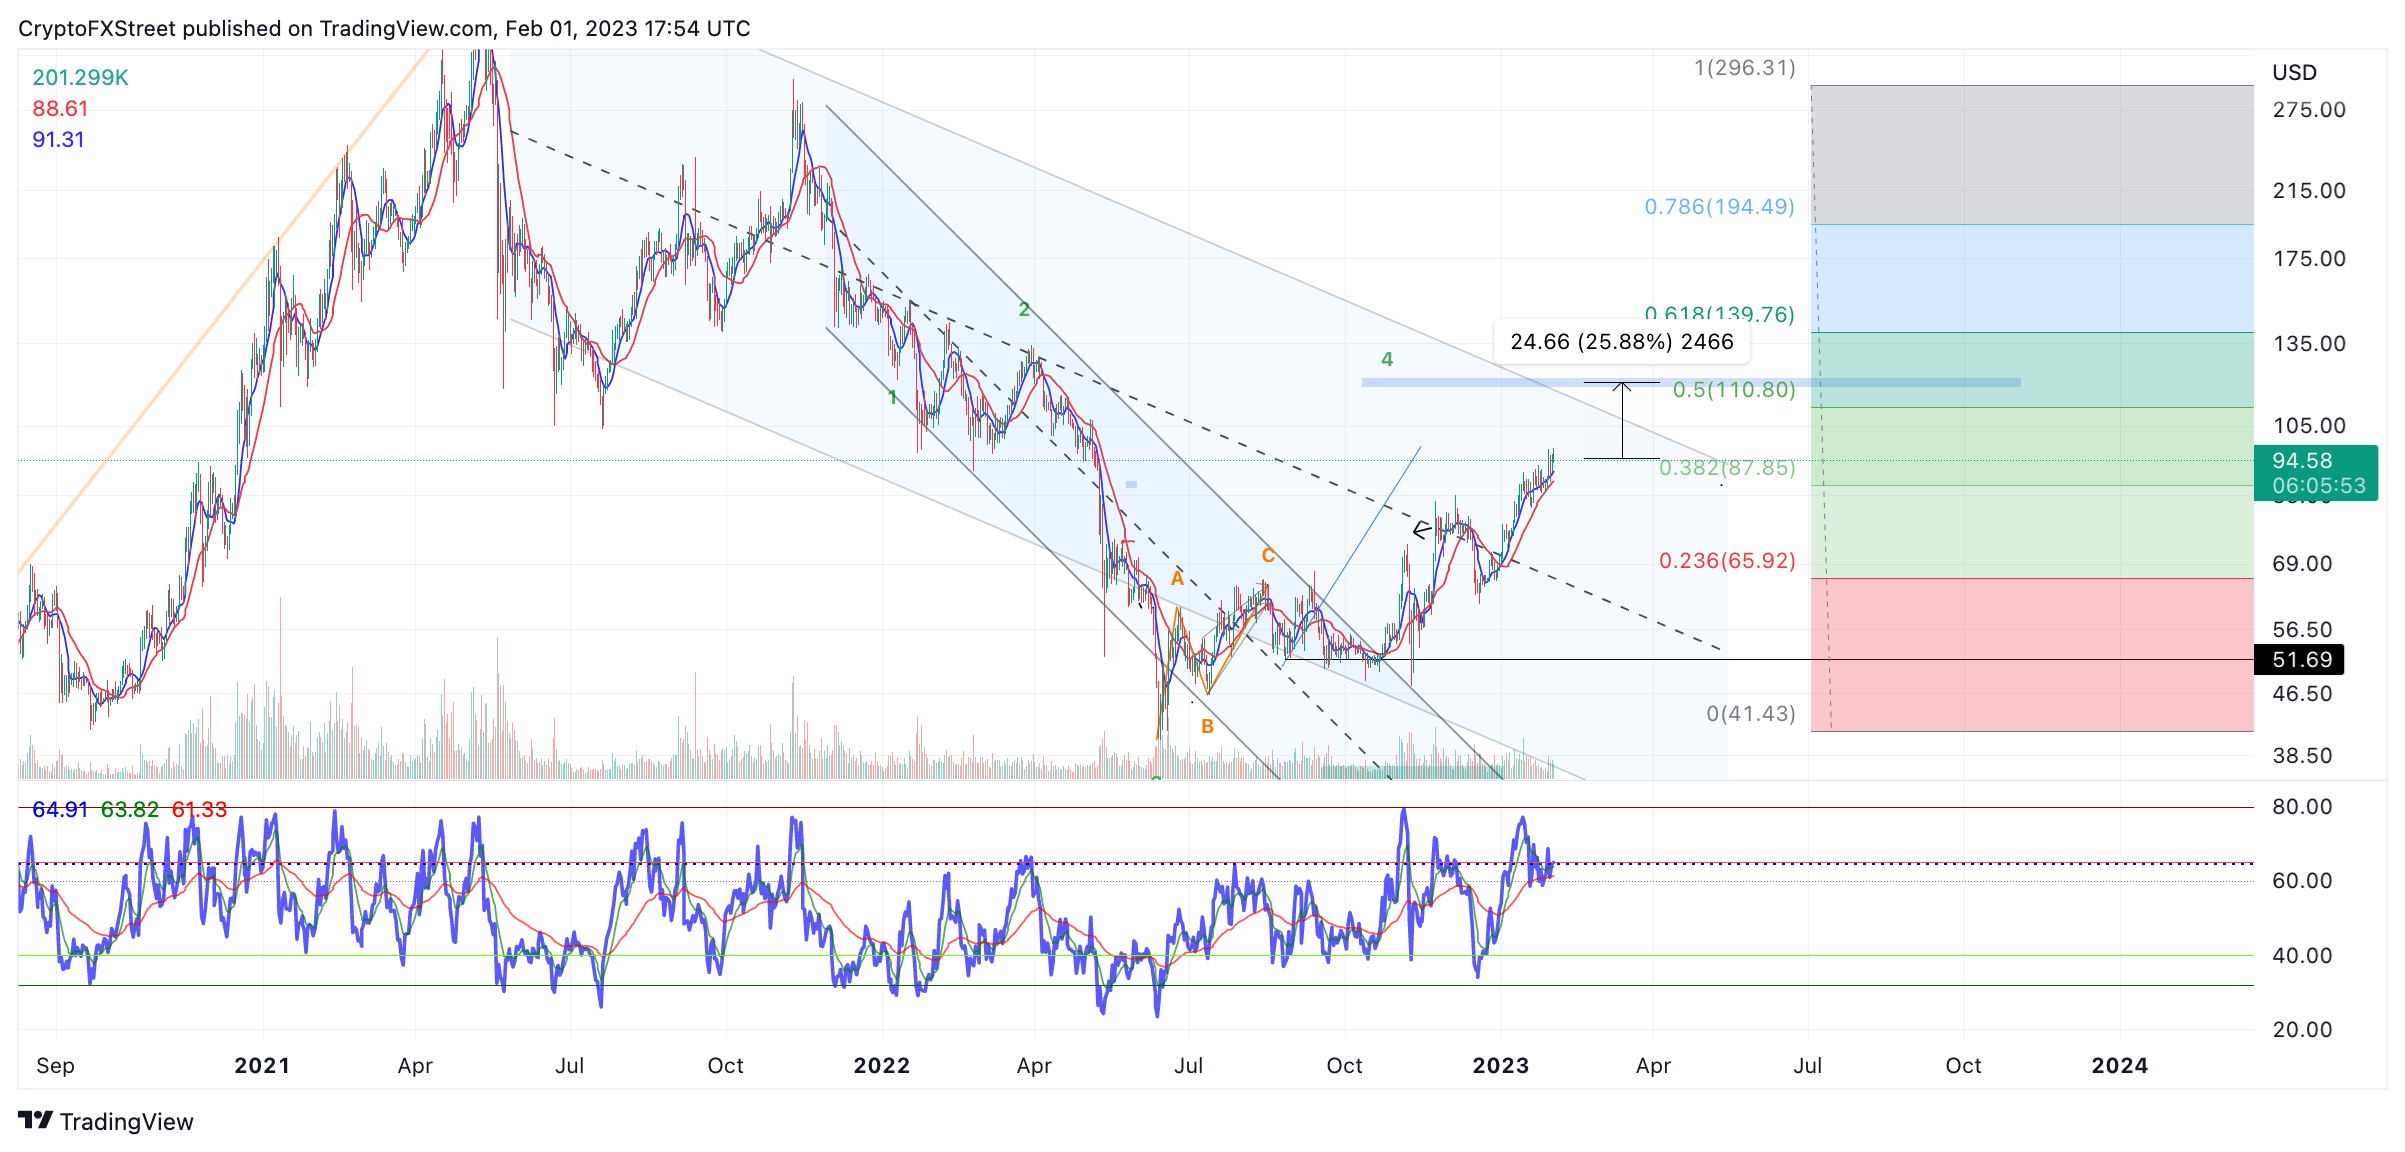
LTC/USDT 1-day chart

Traders looking to enter the market may be able to use the 21-day simple moving average (SMA) as a tool to assess when the uptrend has reversed. A candlestick close beneath the barrier marked at $87 would invalidate the bullish potential. The bears could induce a much deeper decline by targeting liquidity levels as low as $68, resulting in a 27% decline from the current Litecoin price.


Information on these pages contains forward-looking statements that involve risks and uncertainties. Markets and instruments profiled on this page are for informational purposes only and should not in any way come across as a recommendation to buy or sell in these assets. You should do your own thorough research before making any investment decisions. FXStreet does not in any way guarantee that this information is free from mistakes, errors, or material misstatements. It also does not guarantee that this information is of a timely nature. Investing in Open Markets involves a great deal of risk, including the loss of all or a portion of your investment, as well as emotional distress. All risks, losses and costs associated with investing, including total loss of principal, are your responsibility. The views and opinions expressed in this article are those of the authors and do not necessarily reflect the official policy or position of FXStreet nor its advertisers. The author will not be held responsible for information that is found at the end of links posted on this page.

If not otherwise explicitly mentioned in the body of the article, at the time of writing, the author has no position in any stock mentioned in this article and no business relationship with any company mentioned. The author has not received compensation for writing this article, other than from FXStreet.

FXStreet and the author do not provide personalized recommendations. The author makes no representations as to the accuracy, completeness, or suitability of this information. FXStreet and the author will not be liable for any errors, omissions or any losses, injuries or damages arising from this information and its display or use. Errors and omissions excepted.

The author and FXStreet are not registered investment advisors and nothing in this article is intended to be investment advice.

Join Telegram

Recommended content


Recommended Content

Editors’ Picks

Ethereum dips slightly amid Renzo depeg, BlackRock spot ETH ETF amendment

Ethereum dips slightly amid Renzo depeg, BlackRock spot ETH ETF amendment

Ethereum (ETH) suffered a brief decline on Wednesday afternoon despite increased accumulation from whales. This follows Ethereum restaking protocol Renzo restaked ETH (ezETH) crashing from its 1:1 peg with ETH and increased activities surrounding spot Ethereum ETFs.

More Ethereum News

Injective price weakness persists despite over 5.9 million INJ tokens burned

Injective price weakness persists despite over 5.9 million INJ tokens burned

Injective (INJ) price is trading with a bearish bias, stuck in the lower section of the market range. The bearish outlook abounds despite the network's deflationary efforts to pump the price. Coupled with broader market gloom, INJ token’s doomed days may not be over yet.

More Injective News

US intensifies battle against crypto privacy protocols following crackdown on Samourai Wallet

US intensifies battle against crypto privacy protocols following crackdown on Samourai Wallet

CEO Keonne Rodriguez and CTO William Lonergan of Samourai Wallet were arrested by the US Department of Justice (DoJ) on Wednesday and charged with $100 million in money laundering on a count and illegal money transmitting on another count. This move could see privacy-focused cryptocurrencies take a dip.

More Cryptocurrencies News

Near Protocol Price Prediction: NEAR fulfills targets but a 10% correction may be on the horizon

Near Protocol Price Prediction: NEAR fulfills targets but a 10% correction may be on the horizon

Near Protocol price has completed a 55% mean reversal from the bottom of the market range at $4.27. Amid growing bearish activity, NEAR could drop 10% to the $6.00 psychological level before a potential recovery. A break and close above $7.95 would invalidate the downleg thesis.

More Near Protocol News

Bitcoin: BTC post-halving rally could be partially priced in Premium

Bitcoin: BTC post-halving rally could be partially priced in

Bitcoin (BTC) price briefly slipped below the $60,000 level for the last three days, attracting buyers in this area as the fourth BTC halving is due in a few hours. Is the halving priced in for Bitcoin? Or will the pioneer crypto note more gains in the coming days? 

Read full analysis

BTC

ETH

XRP