Litecoin Price Prediction: LTC confirms 38% upswing
- Litecoin price broke out of a symmetrical triangle pattern’s upper trend line, confirming a 38% bull rally.
- The SuperTrend indicator’s buy signal and transactional data provide a tailwind to this bullish outlook.
- Slicing through the MRI’s breakout line at $177.30 could kickstart a new downtrend.

The Litecoin price hints at a massive bull rally as it shattered the upper trend line of a technical pattern.
Litecoin price eyes a higher high
On the 12-hour chart, the Litecoin price is trading at $220.98 after breaking out of a symmetrical triangle pattern. This technical formation is a result of lower highs and higher lows connected using trend lines.
As LTC progresses through the setup, its price gets squeezed until a violent breakout occurs in either direction. The symmetrical triangle’s 38% target is determined by adding the distance between the pivot high and low to the breakout point at $214.87.
This move places the Litecoin price target at $297.17.
The recent 8% surge seen on April 5 resulted in a breakout and triggered the SuperTrend indicator’s buy signal. Hence, a continuation of this bullish momentum shows the promise of a 38% upswing.
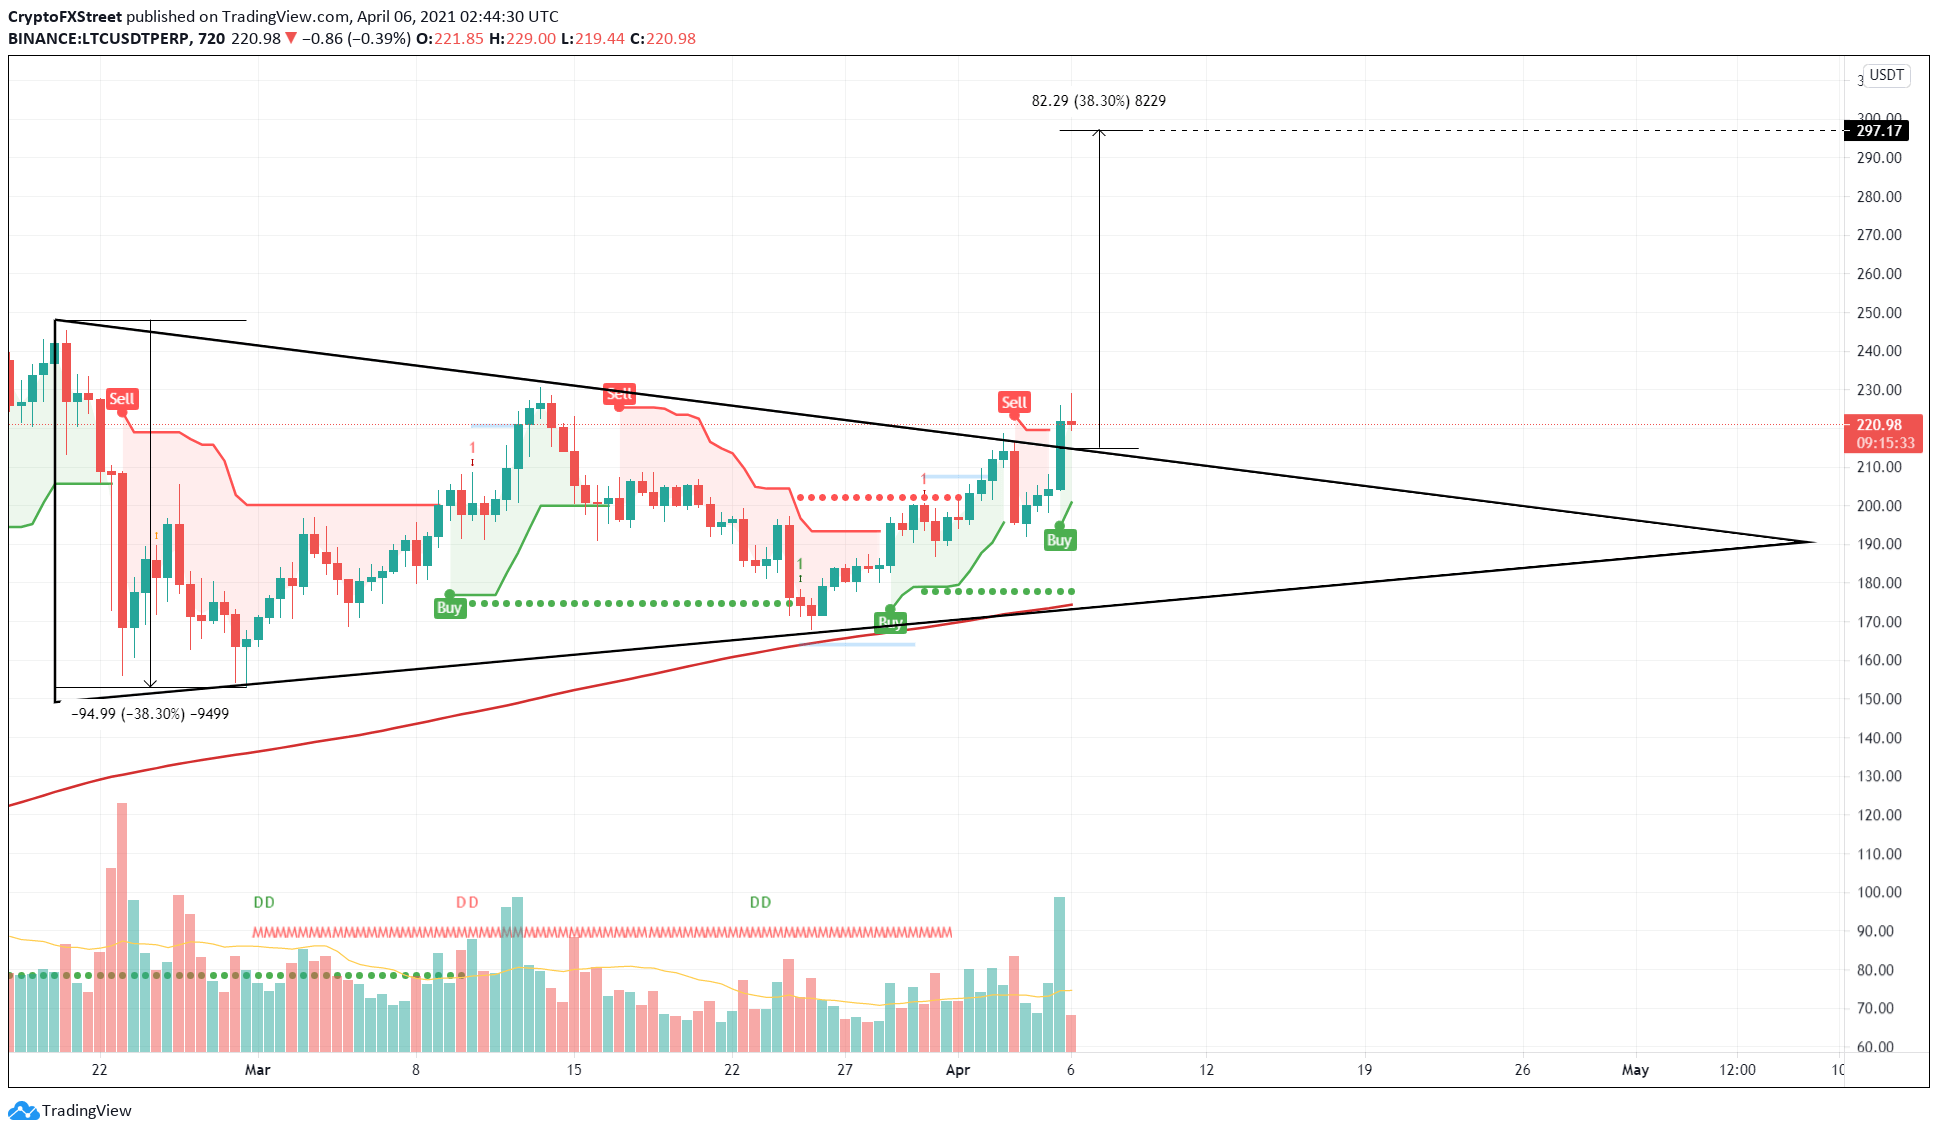
LTC/USDT 12-hour chart
IntoTheBlock’s In/Out of the Money Around Price (IOMAP) model adds credence to the bullish thesis due to the lack of resistance barriers. This metric reveals 30,000 addresses that purchased 1.86 million LTC at an average price of $230.50 are “Out of the Money” and will deter any upside moves.
Hence, overcoming this supply barrier will provide bulls with a clear path toward the intended target at $297.17.
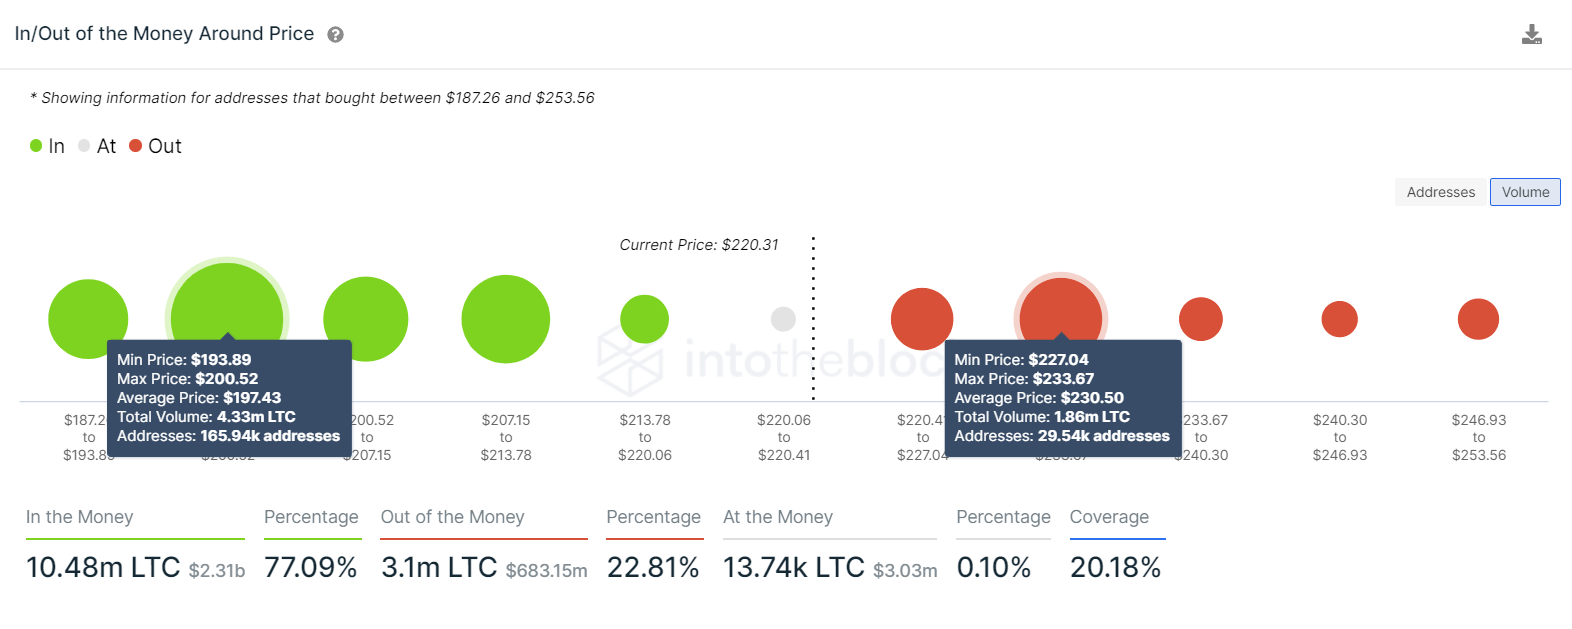
Litecoin IOMAP chart
Additionally, the daily active addresses metric shows a 31% increase in the last 24 hours, with nearly 60,000 new market participants joining the Litecoin network. This addition represents an interest among investors who believe in the bullish potential of LTC.
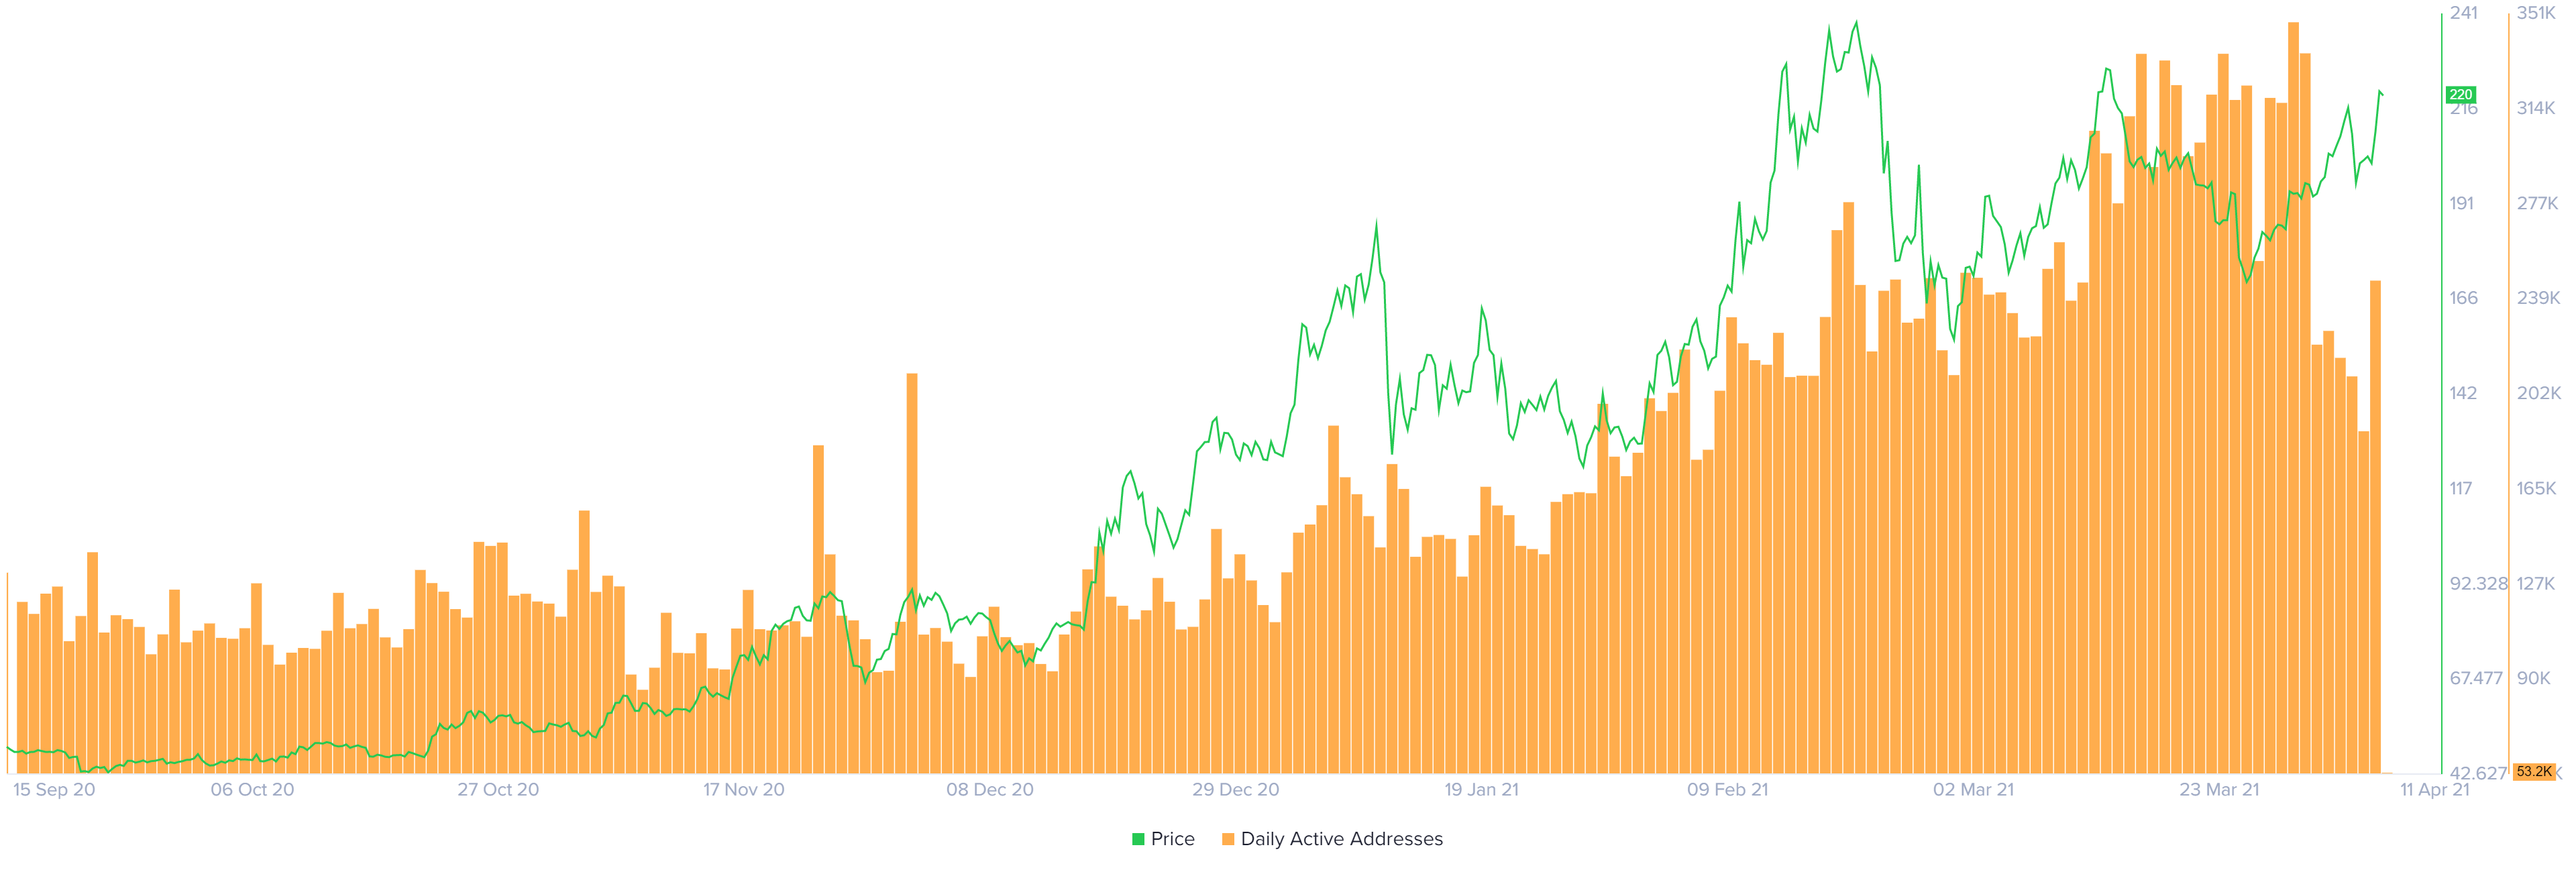
Litecoin daily active addresses chart
Santiment’s 30-day MVRV model for Litecoin shows a slight 9.5% bump. This increase reveals that only a small number of investors are in profit, so a sell-off scenario is unlikely. All in all, this metric suggests the Litecoin price has more room to grow.
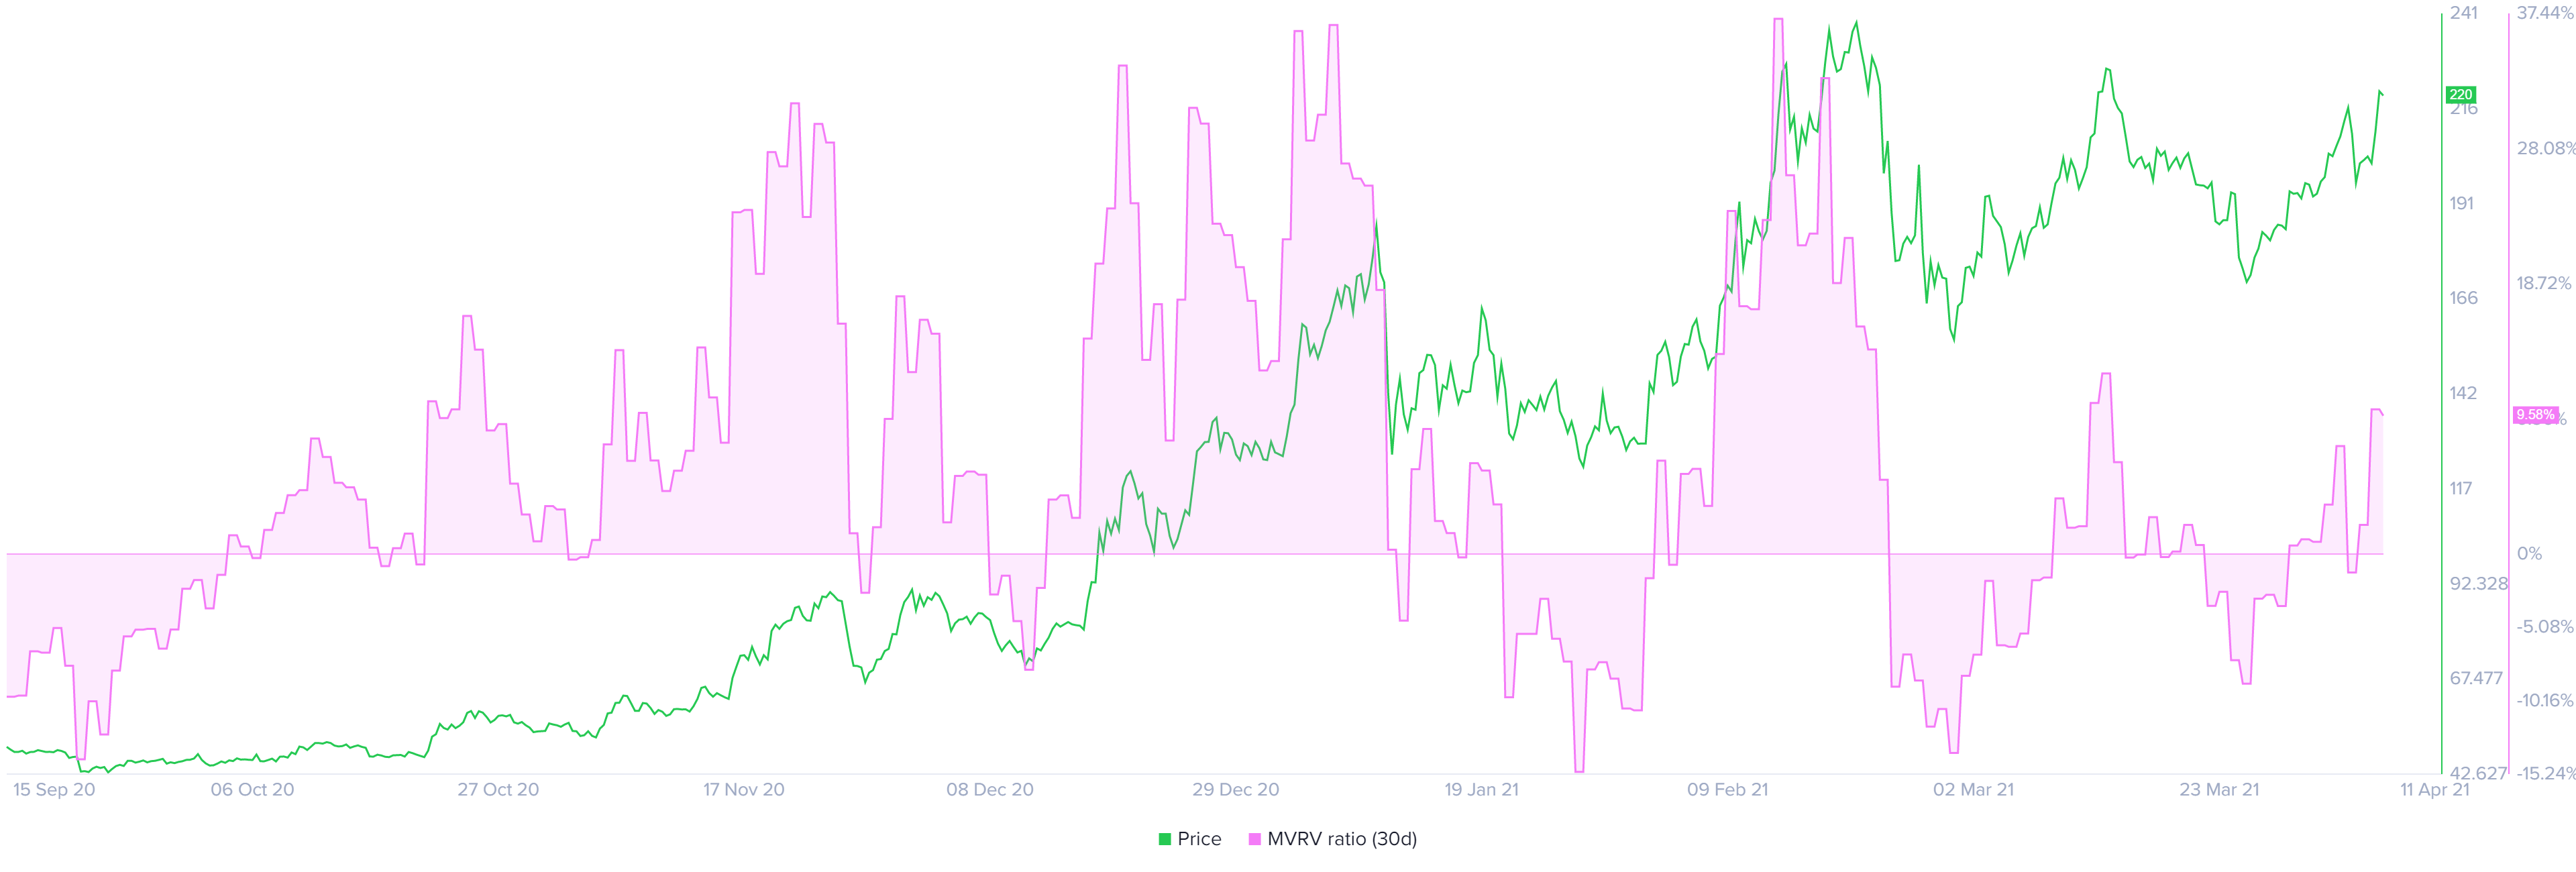
Litecoin MVRV 30-day chart
While things seem to be looking up for the Litecoin price, investors need to be aware of the $197 demand barrier. If sellers manage to shatter this level, it will add to bearish momentum as it pushes investors in this zone to be unprofitable.
Invalidation of the bullish thesis will occur if sustained price action occurs below this level. In such a scenario, the LTC price could slide toward the immediate demand barrier near the lower trend line at $177.30.
Author

Akash Girimath
FXStreet
Akash Girimath is a Mechanical Engineer interested in the chaos of the financial markets. Trying to make sense of this convoluted yet fascinating space, he switched his engineering job to become a crypto reporter and analyst.


![Hyperliquid representatives, Trade[XYZ] meet SEC Crypto Task Force to discuss digital asset regulation](https://editorial.fxsstatic.com/images/i/Hyperliquid_Bull.png)
