Litecoin Price Forecast: LTC robust on-chain metrics could support upswing to record highs
- One model reveals immense support and weakening resistance for Litecoin in the short term.
- A separate ratio has reset into the negative region, suggesting it is time to buy into LTC.
- Litecoin hit a barrier at the 100 SMA on the four-hour chart, giving way to the ongoing correction.

Litecoin sustained the uptrend following support around $170. The descending parallel channel’s lower boundary support reinforced the level, leading to gains toward $200. A break above the upper boundary resistance confirmed an upswing to $200. However, the 100 Simple Moving Average (SMA) on the four-hour chart resistance cut short the upswing.
Litecoin seeks higher support to sustain uptrend
Immediate support has been provided by the 200 SMA. Litecoin exchanges hands at $192 at the time of writing. The Relative Strength Index (RSI) shows LTC gradually falling into the bears’ hands.
If support at the 200 SMA remains intact, Litecoin will resume the earlier staged recovery for gains above $200. A step past the 100 SMA would confirm the bullish outlook and trigger buy orders amid speculation for yields toward record highs.
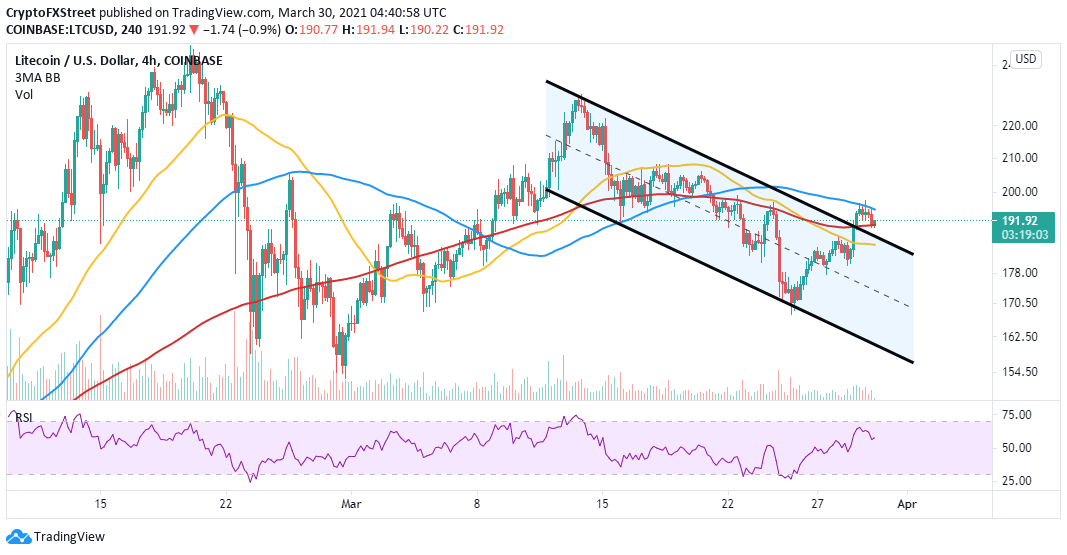
LTC/USD four-hour chart
The market-value-to-realized-value (MVRV) on-chain metric by Santiment has reset from a 30-day top of 12.6%. At the time of writing, the MVRV stands at 8.97%, implying that most Litecoin holders are at a loss. In other words, investors are unlikely to sell until they breakeven and get a considerable return on investment. Therefore, Litecoin is back in the buy zone, offering an opportunity to enter the market or increase a stake.
%20[08.00.15,%2030%20Mar,%202021]-637526797976152157.png)
Litecoin MVRV model
Litecoin’s vivid bullish outlook has also been validated by the robust support revealed by the IOMAP model. This anchor zone runs from $185.2 to $190.5. Here, roughly 168,000 addresses previously bought approximately 4.24 million LTC. It would not be easy breaking through this support, thus validating the upswing toward the record high.
On the upside, a weakening resistance has been observed using the IOMAP model. Our attention is drawn to the region running from $196.7 to $202.26. Here, around 95,000 addresses purchased 1.8 million LTC. If the above technical analysis holds and Litecoin swings above this zone, buy orders are likely to be triggered, adding pressure to the tailwind.
-637526798065126911.png)
Litecoin IOMAP model
Looking at the other side of the picture
It is worth mentioning that Litecoin may continue to drop due to the resistance at the 100 SMA. Moreover, the bearish leg would extend further if the 200 SMA support fails to hold. On the downside, support is envisioned at the ascending channel’s upper boundary. If push comes to shove, the 50 SMA would be tested.
Author

John Isige
FXStreet
John Isige is a seasoned cryptocurrency journalist and markets analyst committed to delivering high-quality, actionable insights tailored to traders, investors, and crypto enthusiasts. He enjoys deep dives into emerging Web3 tren


