Litecoin price likely to crash 9% as dead-cat bounce scenario unfolds
- Litecoin price has broken below the key daily support level at around $82.4.
- On-chain data shows that 432,070 addresses have sold LTC between the $81.64 and $83.88 range.
- A daily candlestick close above $82.40 would invalidate the bearish thesis.

Litecoin (LTC) price outlook has turned bearish after breaking below a key support level, with on-chain data suggesting that holders are losing interest and confidence in the token.
Litecoin price is likely to have a relief rally
Litecoin price closed with 4% losses on Friday, having plummeted by 11% during the day and dropping below the key daily support level of $82.40. In this scenario, LTC might undergo a so-called dead-cat bounce, a short-lived price rise within an overall downtrend, possibly reaching the price imbalance between $80.36 and $83.08.
If the market outlook does not improve, LTC could face resistance at the following levels:
- The midpoint of the imbalance at $81.76, which coincides with the 61.8% Fibonacci retracement level drawn from the swing high of $85.88 on June 6 to the swing low of $75.09 on June 7.
- The daily resistance level at $82.40.
Failure to break above $81.76 might trigger a 9% crash, back to retesting the $75.09 daily support level. The Relative Strength Index (RSI) in the 4-hour chart stands around 36.08, just above the oversold threshold of 30, indicating the possibility of a temporary relief rally before the downward trend resumes.
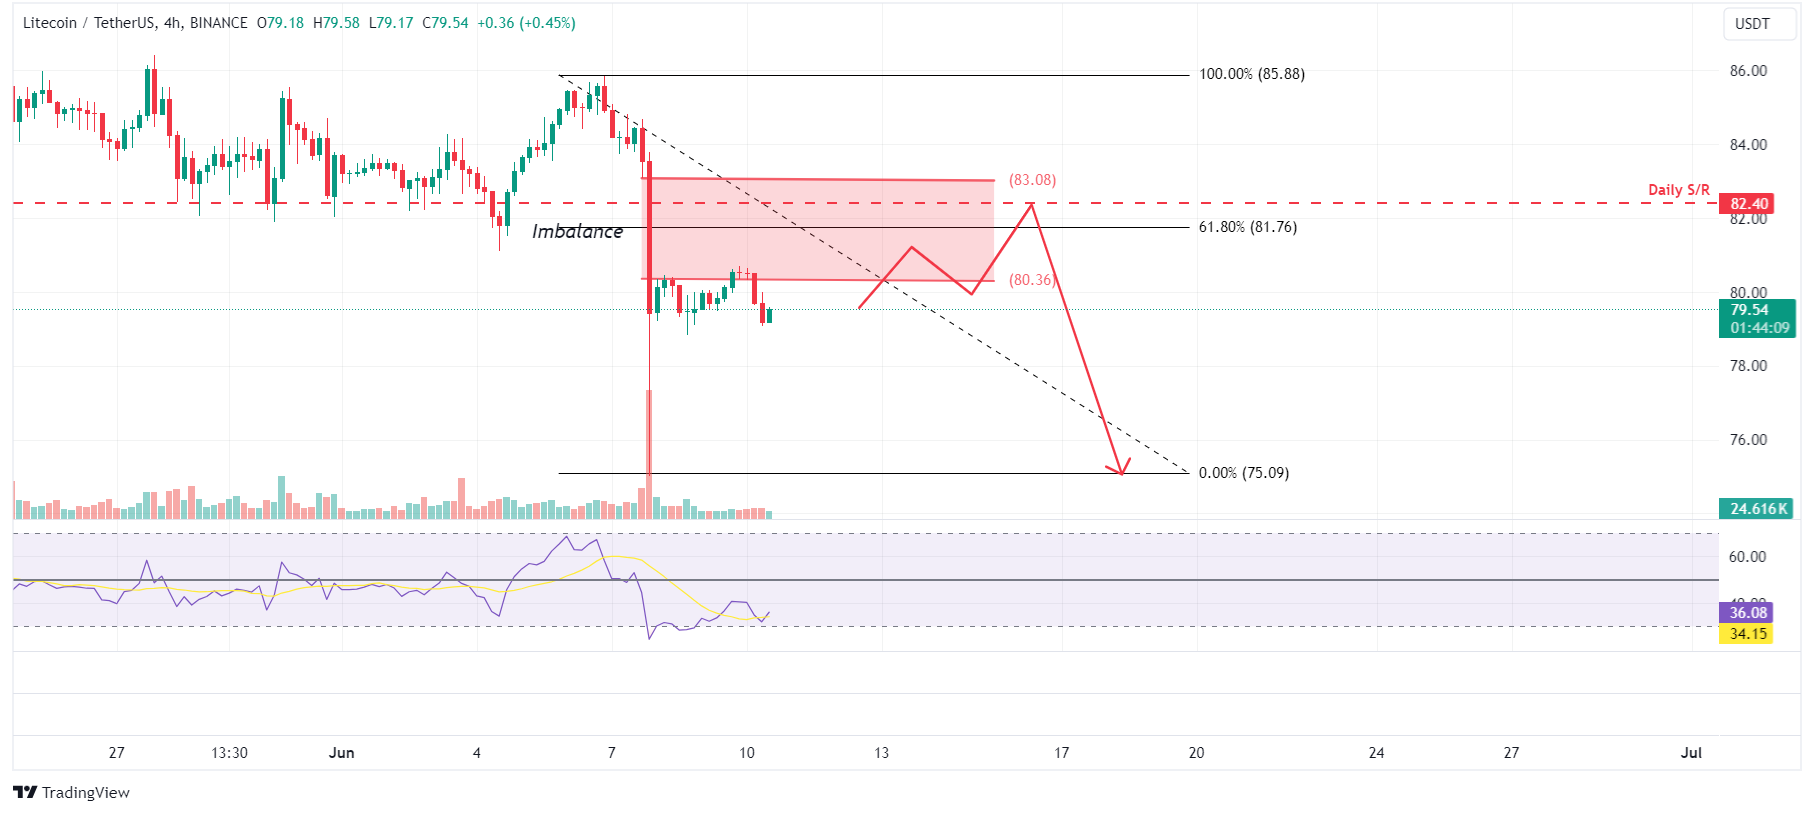
LTC/USDT 4-hour chart
According to IntoTheBlock's In/Out of the Money Map (IOMAP), approximately 432,070 addresses brought 6.67 million LTC tokens at an average price of $82.76, with buys occurring between $81.64 and $83.88. If the price rises into this area, these investors may opt to sell to get a breakeven on their position.
From a technical analysis perspective, the $81.76 resistance level aligns with the IOMAP findings, marking this zone as a crucial reversal point to monitor.
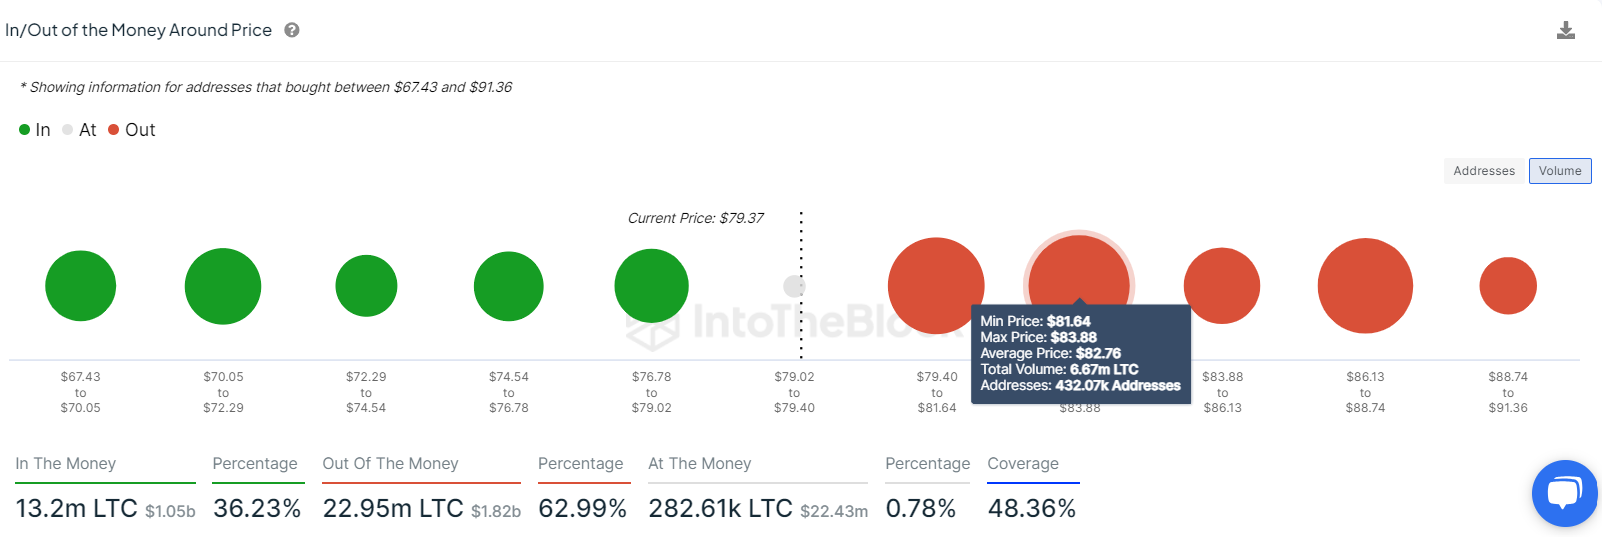
LTC IOMAP chart
On-chain data from IntoTheBlock also presents a bearish outlook for Litecoin. The number of Zero Balance Addresses surged from 195,860 on June 4 to 675,450 on June 8, coinciding with a 6% price crash. This suggests that capital is exiting LTC as holders lose interest or confidence in Litecoin, possibly driven by fear of further losses.
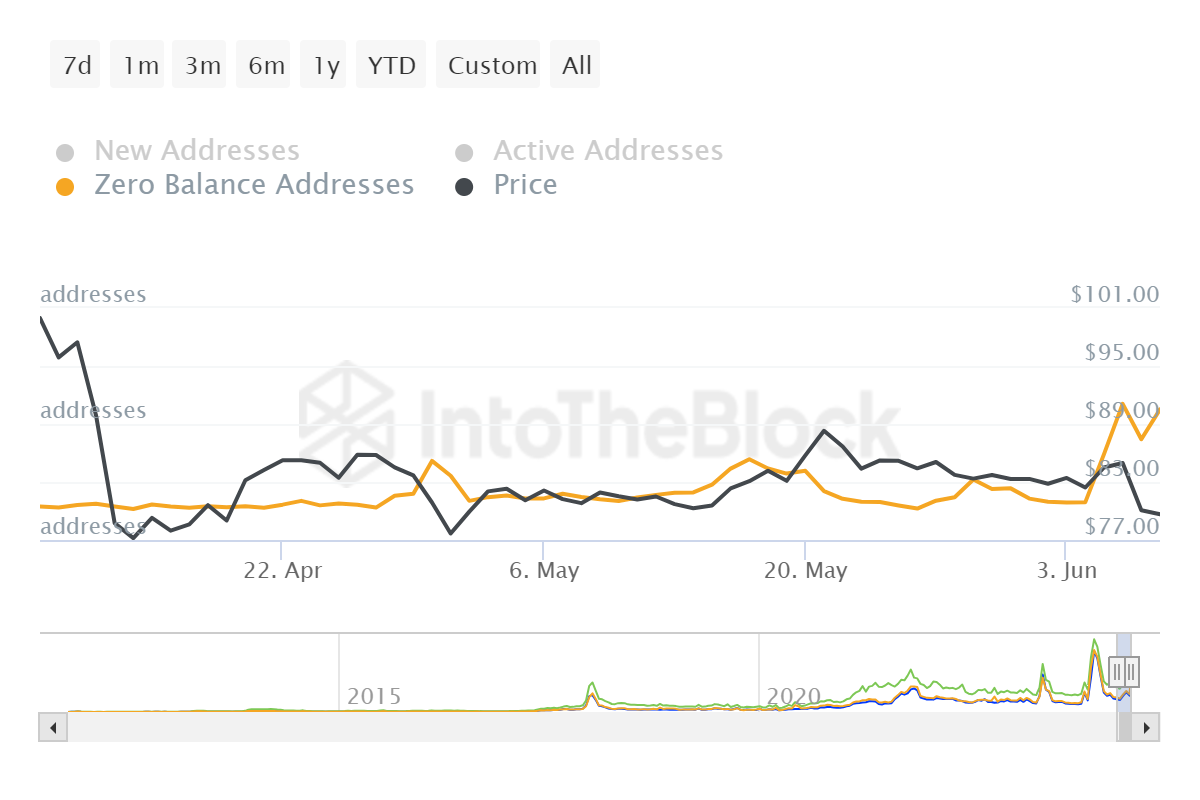
LTC Zero Balance Addresses chart
Despite the bearish outlook suggested by technical analysis and on-chain data, if Litecoin's price closes above $82.40 on the daily time frame, it would invalidate the bearish thesis by creating a higher low. This could trigger a 4% rally, pushing LTC price to the June 6 high of $85.88.
Author

Manish Chhetri
FXStreet
Manish Chhetri is a crypto specialist with over four years of experience in the cryptocurrency industry.