Litecoin Price Analysis: LTC completes technical framework for a 20% rally
- Litecoin is on the verge of a massive technical breakout from a falling wedge pattern.
- The MVRV ratio shows that LTC is in a buy zone, which is a bullish signal.
- Litecoin’s expected breakout may delay due to the resistance illustrated by the IOMAP.

Litecoin is trading 2% higher over the last 24 hours. It is among the few coins dotting the cryptocurrency market green. Meanwhile, short-term technical analysis suggests that a breakout is around the corner, especially with the formation of a falling wedge pattern.
Litecoin flashes massive buy signals
The cryptocurrency is holding in the tenth position, with a market cap of $12.8 billion. A breakout toward the recently traded multi-year high would ensure that LTC remains among the top ten assets.
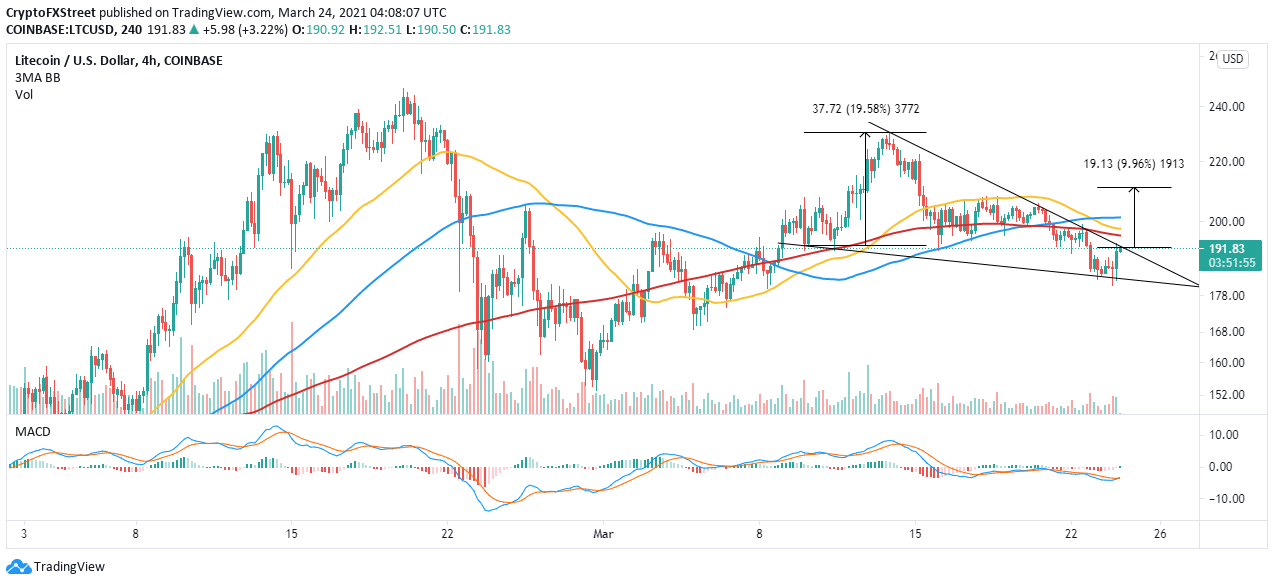
In the meantime, Litecoin is exchanging hands at $191 while battling the resistance at the upper trendline of a falling wedge pattern. This pattern is bullish and results in a massive upswing in maturity. The pattern forms after a considerable upswing in price followed by a period of correction.
A breakout equal to the distance between the highest and lowest points of the pattern is expected as soon as the price slices through the upper trend line. For instance, Litecoin is on the brink of a 20% breakout, likely to bolster it to $211.
The Moving Average Convergence Divergence (MACD) on the 4-hour chart shows that the trending is about to flip bullish. The MACD line (blue) crosses above the signal line, which is called to buy the dip. Moreover, recovery of the indicator into the positive area will catapult LTC significantly upwards.
LTC/USD 4-hour chart
The MVRV on-chain ratio vividly shows Litecoin inside the buy zone. This metric by Santiment tracks the average profit or loss of the holders of LTC tokens that have been moved over the last 30 days compared to the price when each of these tokens last moved.
Note that an MVRV ratio of more than figure 2 implies that Litecoin holders are currently 2x on their initial investment. On the contrary, an MVRV figure of one or less shows that holders are at a loss or yet to break even on their investment. Therefore, they are unlikely to sell, maintaining the buying pressure behind the token.
%20[07.33.30,%2024%20Mar,%202021]-637521584869207806.png)
Litecoin MVRV on-chain metric
Looking at the other side of the picture
IntoTheBlock’s IOMAP model brings to light intense resistance ahead of Litecoin, which is likely to delay the breakout. The most robust seller congestion zone holds between $197.7 and $203.3. Here, around 135,800 addresses had previously scooped roughly 3.8 million LTC.
-637521585254622106.png)
Litecoin IOMAP model
On the downside, Litecoin is sitting on top of an area with immense support highlighted between $180 and $186. Here, nearly 92,000 addresses had previously bought approximately 3.3 million LTC. It is doubtful that Litecoin will slice through this zone thus, giving way to a consolidation period.
Author

John Isige
FXStreet
John Isige is a seasoned cryptocurrency journalist and markets analyst committed to delivering high-quality, actionable insights tailored to traders, investors, and crypto enthusiasts. He enjoys deep dives into emerging Web3 tren


![Hyperliquid representatives, Trade[XYZ] meet SEC Crypto Task Force to discuss digital asset regulation](https://editorial.fxsstatic.com/images/i/Hyperliquid_Bull.png)
