- Litecoin is likely to settle in a range between $46 and $50.
- The technical picture is positive as a sign of buyer relentlessness in pushing for recovery.
Litecoin has been shredding its value since June highs around $146. The halving event in August did very little to spur growth. Instead, the crypto has continued to shred its value beneath several key support levels including $80, $60 and the recent break below $50.
Following the breakdown $42 level came out as a vital support area, Litecoin bulls took advantage of the low price to get more positions. However, the momentum has not been strong enough to convince the bulls that the reversal is significant.
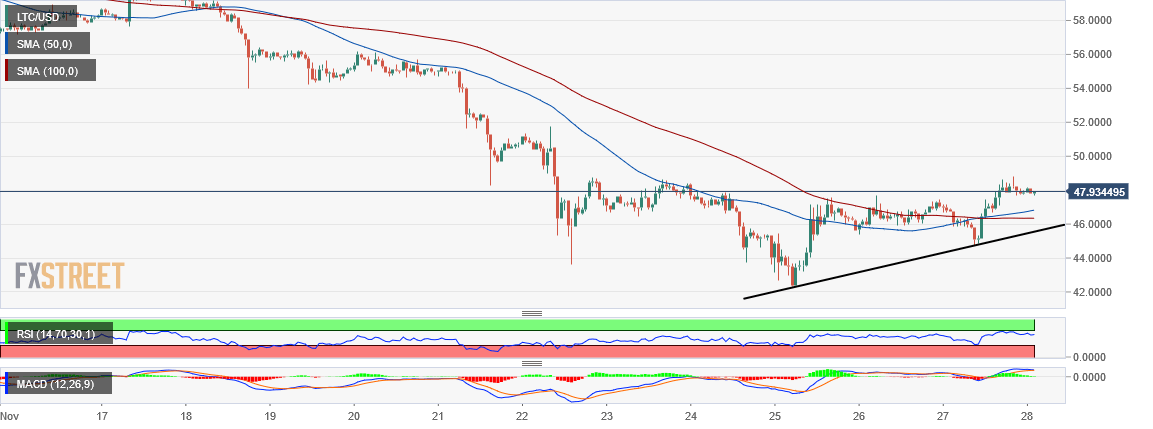
Meanwhile, LTC is exchanging hands at $47.90, sitting above the moving averages. The 50 SMA double-cross above the 100 SMA on the 1-hour chart, shows that LTC is attracting bullish influence. In the event of a reversal, the 50 SMA and the 100 SMA at $46.83 and $46.36 respectively will provide support.
The uptrend is also being nurtured above rising trendline support whose support is still intact. The RSI hints sideways trading trend in the coming sessions. The MACD shows that the momentum is in favor of the bulls and more action northwards is possible.
LTC/USD 1-hour chart

Information on these pages contains forward-looking statements that involve risks and uncertainties. Markets and instruments profiled on this page are for informational purposes only and should not in any way come across as a recommendation to buy or sell in these assets. You should do your own thorough research before making any investment decisions. FXStreet does not in any way guarantee that this information is free from mistakes, errors, or material misstatements. It also does not guarantee that this information is of a timely nature. Investing in Open Markets involves a great deal of risk, including the loss of all or a portion of your investment, as well as emotional distress. All risks, losses and costs associated with investing, including total loss of principal, are your responsibility. The views and opinions expressed in this article are those of the authors and do not necessarily reflect the official policy or position of FXStreet nor its advertisers. The author will not be held responsible for information that is found at the end of links posted on this page.
If not otherwise explicitly mentioned in the body of the article, at the time of writing, the author has no position in any stock mentioned in this article and no business relationship with any company mentioned. The author has not received compensation for writing this article, other than from FXStreet.
FXStreet and the author do not provide personalized recommendations. The author makes no representations as to the accuracy, completeness, or suitability of this information. FXStreet and the author will not be liable for any errors, omissions or any losses, injuries or damages arising from this information and its display or use. Errors and omissions excepted.
The author and FXStreet are not registered investment advisors and nothing in this article is intended to be investment advice.
Recommended Content
Editors’ Picks
Kyber exploiter asks for complete control of all assets after nearly $50 million exploit

Kyber network exploiter drained the protocol’s liquidity pools of nearly $50 million on November 22. The team behind Kyber managed to recover $4.67 million and communicated with the exploiter for the remainder of assets.
Chainlink supply on exchanges hits lowest point since 2020, with LINK staking v0.2 launch

Chainlink supply on exchanges declined to a level previously seen in February 2020. LINK staking v0.2 went live on November 28, attracting 68% of staked tokens from v0.1.
Bitcoin Spot ETF applications see amendments, holders await January batch approval

Bitcoin Spot ETF race has late entrants and updates from BlackRock, according to James Seyffart. BTC Spot ETF approval anticipation has fueled a rally in both spot and futures markets.
Ethereum Price Prediction: ETH top-down analysis hints upside is capped at $2,500

Ethereum price trades in a clear consolidative trend on the weekly time frame between $1,933 and $2,141 barriers. The daily chart for ETH shows a sweep of Monday’s high is likely to be followed by a sweep of Monday’s low at $1,985.
Three key BTC accumulation levels before ETF approval in January 2024

Bitcoin, from a high time-frame perspective, has been in an up-only trend since the start of 2023. BTC has ignored many sell signals due to the likelihood of an Exchange-Traded Fund approval. With the holidays around the corner, falling liquidity could see BTC discounted from its current level, hovering around the $37,000 region.