Litecoin eyes fresh all-time highs [Video]
![Litecoin eyes fresh all-time highs [Video]](https://editorial.fxstreet.com/images/Markets/Currencies/Digital Currencies/Litecoin/Litecoin_1.jpg)
Litecoin has broken past its February high of $250 this week and it’s looking to get closer to the all-time high of $370.
Despite a recent attempt to capture the $300 failing, bulls maintain a positive footing above the $263 handle.
With both the main and alternative scenarios suggesting an imminent final leg in wave (5) of ⑤, it will be interesting to see where the bullish cycle completes.
Multi-structural upside hints at impulse
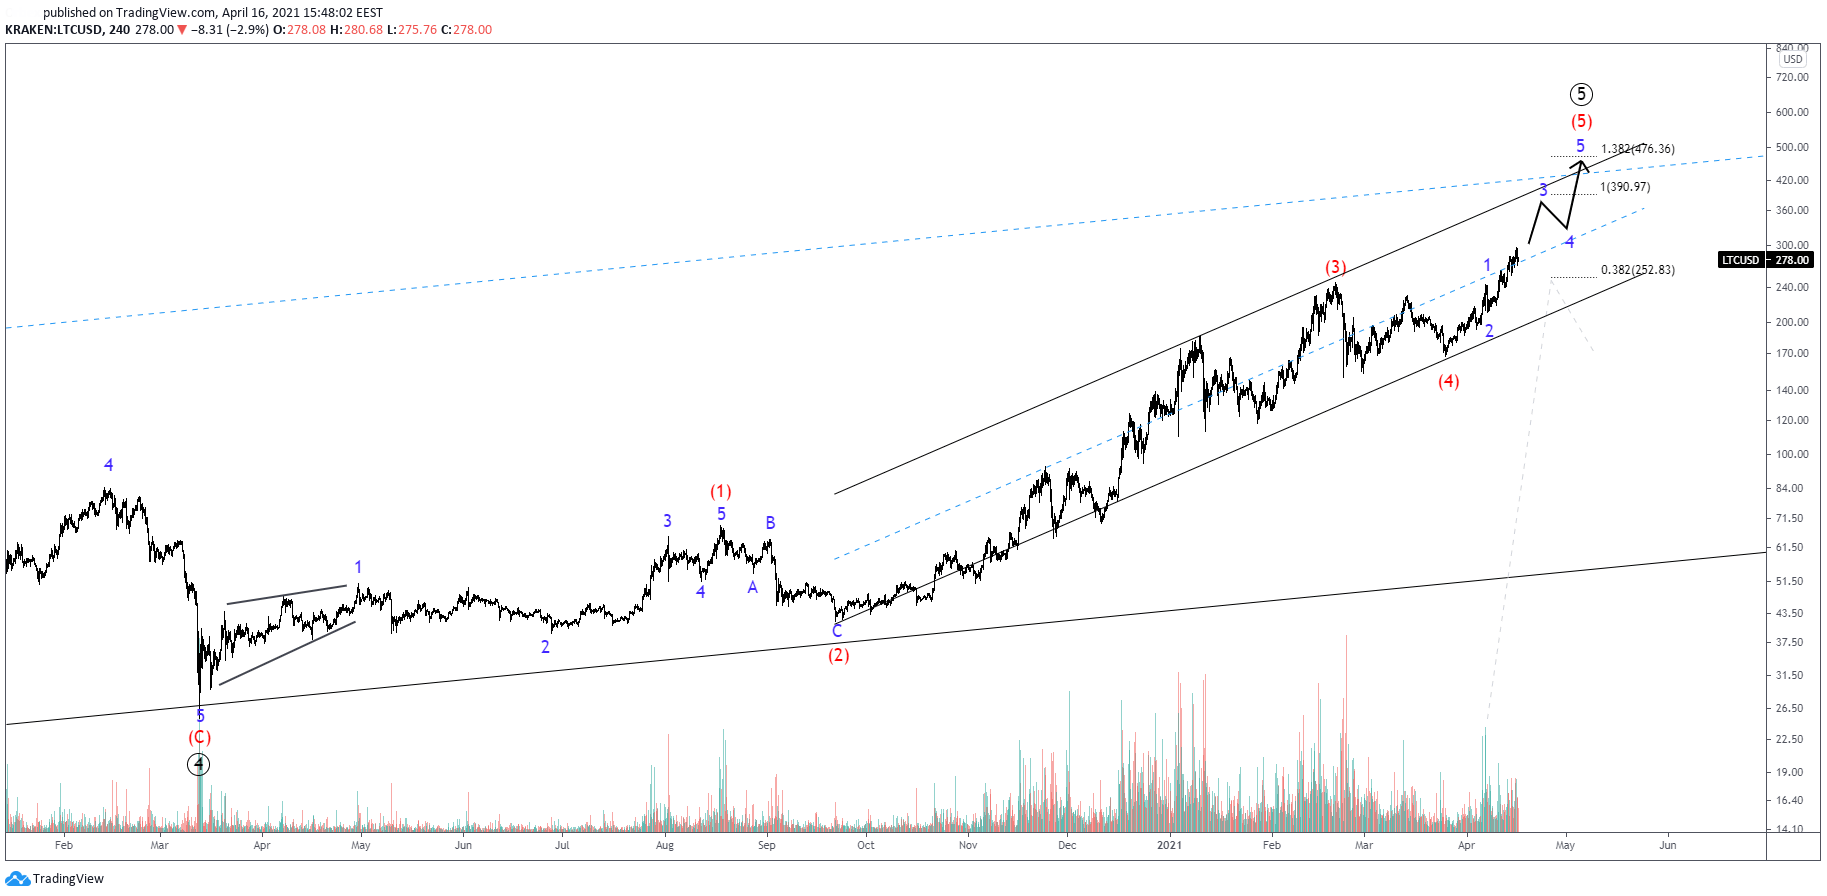
The main Elliott Wave scenario suggests that we are extending higher in intermediate wave (5); this is the last and final bullish impulse wave, compiled by minor waves 12345.
Since wave 1 completed at the 0.382 Fibonacci extension of waves (1)(2)(3)(4), wave 3 is expected to reach the 100% Fibonacci extension at $390.
Should this play out to bulls’ favor, a correction in 4 could then be followed by the last upside move in wave 5 of (5), near the 1.382 Fibonacci extension of waves (1)(2)(3)(4) at $476.
At this level, a cluster between the short and long-term channels is likely to form.
Depth of correction to determine cycle completion
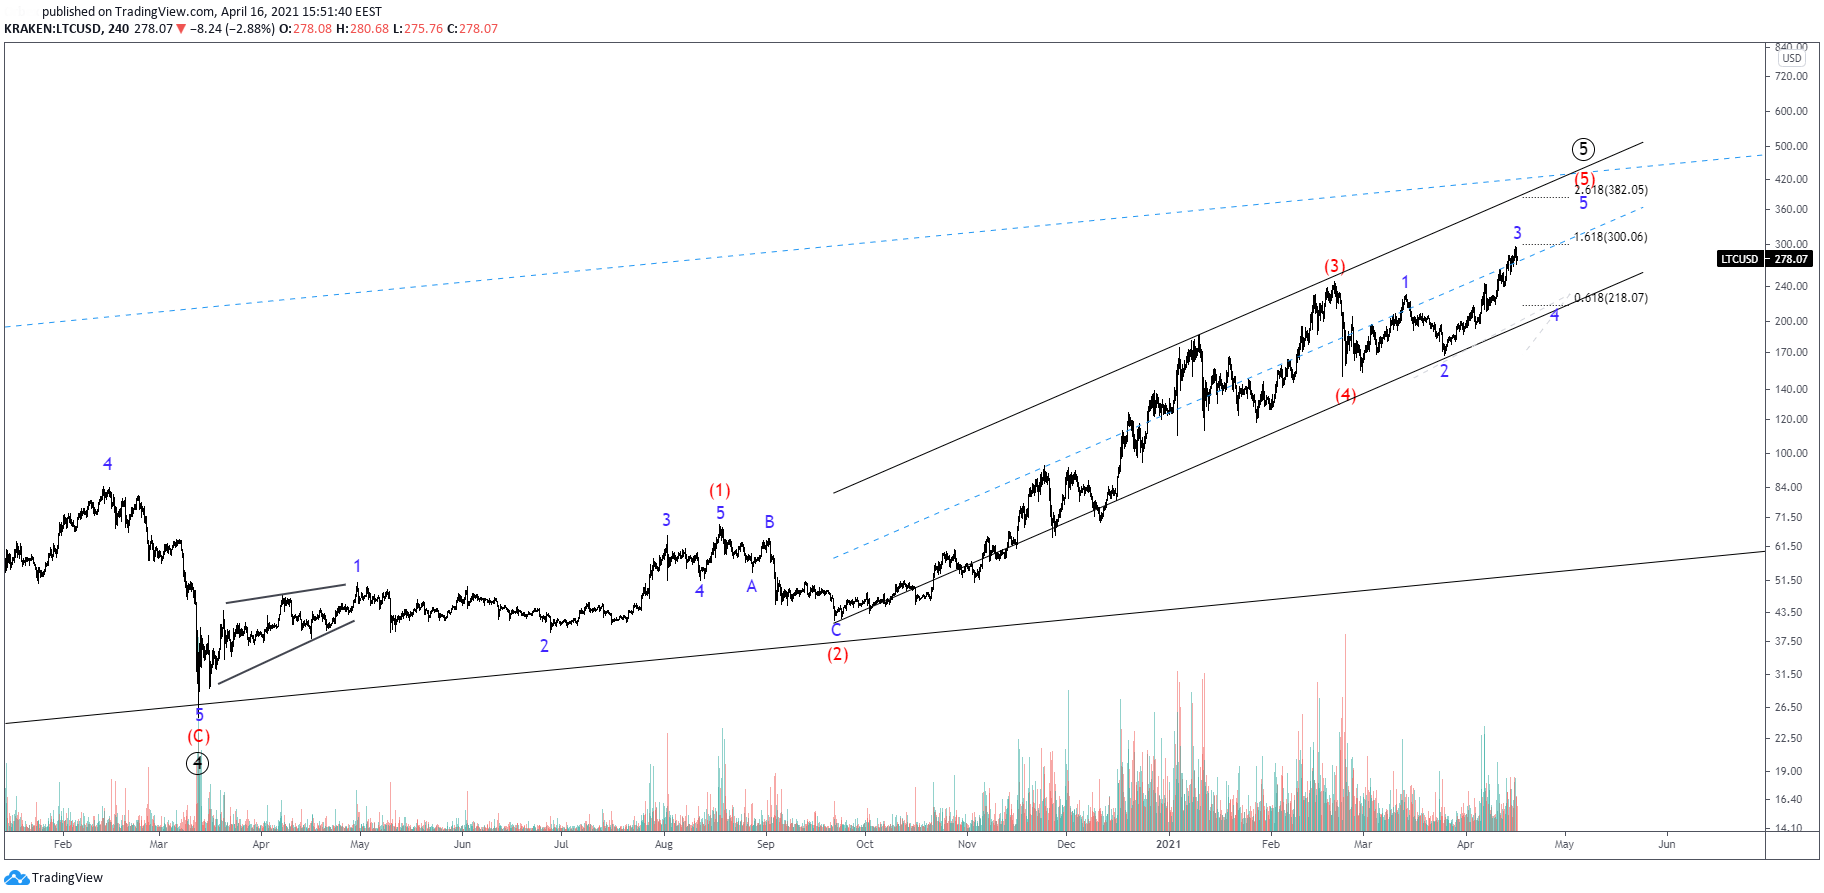
If prices start correcting earlier – i.e. we get a shorter wave 3, or, we get a deeper correction that wave 4 overlaps wave 1, the chances of wave (5) turning into an ending diagonal will increase.
With that scenario in mind, wave 3 just reached the 1.618 Fibonacci extension of waves 12 and a correction could be therefore expected any minute.
Despite the depth of the pullback is unknown, we can expect wave 4 to remain a tad higher than wave 2’s low. That said, the 0.618% Fibonacci extension of waves 12 makes a good candidate since it respects both conditions.
Once the low is in, prices could be expected to make a last corrective upside move towards fresh highs. However, if wave 5 falls short fresh all-time highs will be harder to see.
Subjective but still relevant to cycle’s extension
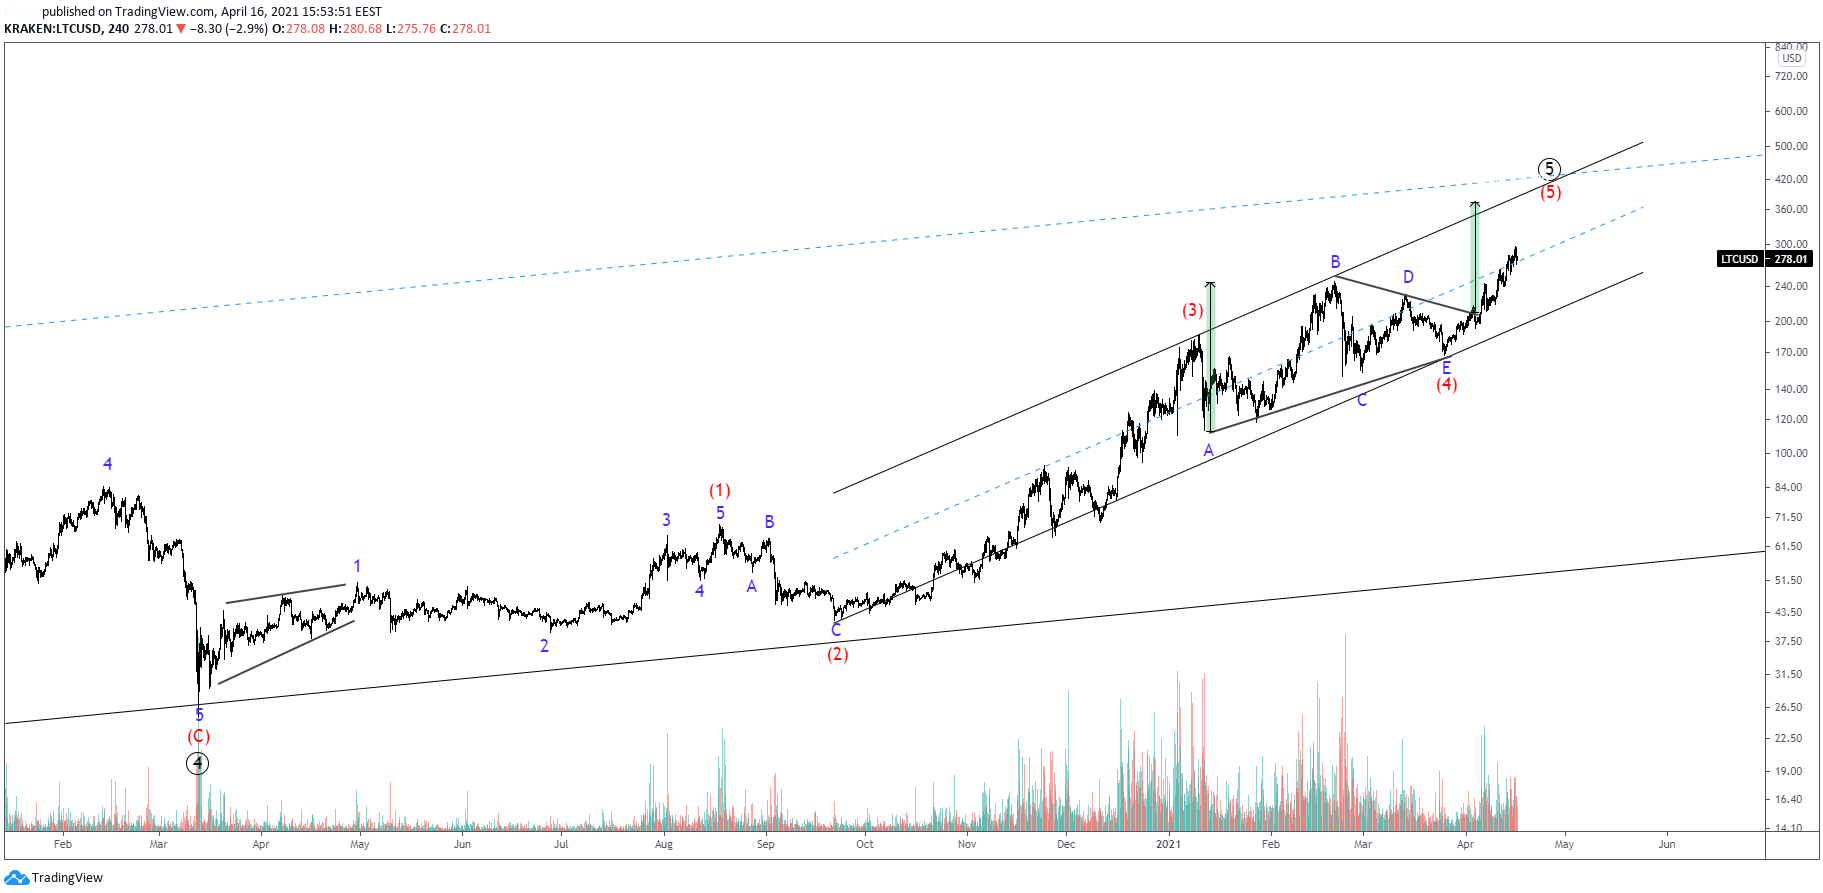
In this last scenario, we don’t focus on the last wave and whether it expands impulsively or correctively, but on wave (4).
Wave (4) completes at the same low we identified in the main scenario. However, this time as a triangle.
Although one would think that makes no difference to where the cycle completes, in reality, and based on market research, we often see wave (5) extending the range of the opening of a triangle. That would be near $370.
Should this become a triangle in wave (4) we will know only once the last wave prints wave (5).
Elliott Waves suggest more upside either way
Any of the patterns the current market structure shows, see more upside for litecoin, which may or may not be used as an indicator itself.
Often, the market datashow two or three scenarios that suggest an opposite course of price action. However, rarely, when most high probability scenarios point at the same direction, this can be used to our advantage.
Author

Stavros Tousios
Independent Analyst
Stavros is leading the Investment Research Team at a reputable Forex broker. He has been involved in the financial markets since 2014 and in cryptocurrencies trading since 2017.



