Here’s how SHIB, BONE and LEASH holders can benefit from Shiba Inu layer-2 Shibarium’s launch
- Shiba Inu ecosystem developers share the utility of SHIB, BONE and LEASH in the layer-2 scaling solution Shibarium.
- Shibarium will soon join Ethereum-based blockchains Arbitrum and Optimism to tackle challenges of scalability, speed and expense.
- Shiba Inu price is tackling resistance at $0.00001041, the 23.6% Fibonacci retracement level, a breakout could push SHIB to $0.00001110.
Shiba Inu, the second largest meme coin in the crypto ecosystem, dropped details of the upcoming launch of layer-2 scaling solution Shibarium. Three Shiba Inu ecosystem tokens: SHIB, BONE and LEASH will derive utility from the scaling solution.
Also read: Shiba Inu and SHIB The Metaverse gear up to offer first preview of the WAGMI Temple
Shiba Inu ecosystem tokens SHIB, BONE and LEASH to find utility in Shibarium
Shiba Inu, the meme coin’s developers are preparing for layer-2 scaling solution Shibarium’s launch. SHIB, BONE and LEASH tokens from the Shiba Inu ecosystem will find utility in the layer-2 scaling solution. Developers dropped details of Shibarium’s launch in a recent blog post on January 15.
Shibarium will soon join the list of Ethereum-based blockchains like Arbitrum and Optimism, and tackle scalability issues for the Shiba-Inu-themed cryptocurrency. Layer-2 blockchains do the majority of the processing work, and alleviate bandwidth to lower gas fees and processing time for end users.
The layer-2 scaling solution will therefore find cost and speed benefits, developing a framework for Shibarium. Native token BONE will be used to pay for gas transactions and rewarding validators and delegators on Shibarium protocol.
Shiba Inu bulls attempt to push SHIB to $0.00001110
Shiba Inu bulls set the target of $0.00001110. SHIB is currently tackling resistance at the 38.2% Fibonacci retracement level. Above the $0.00001110, the targets are Fibonacci retracement levels from the weekly chart.
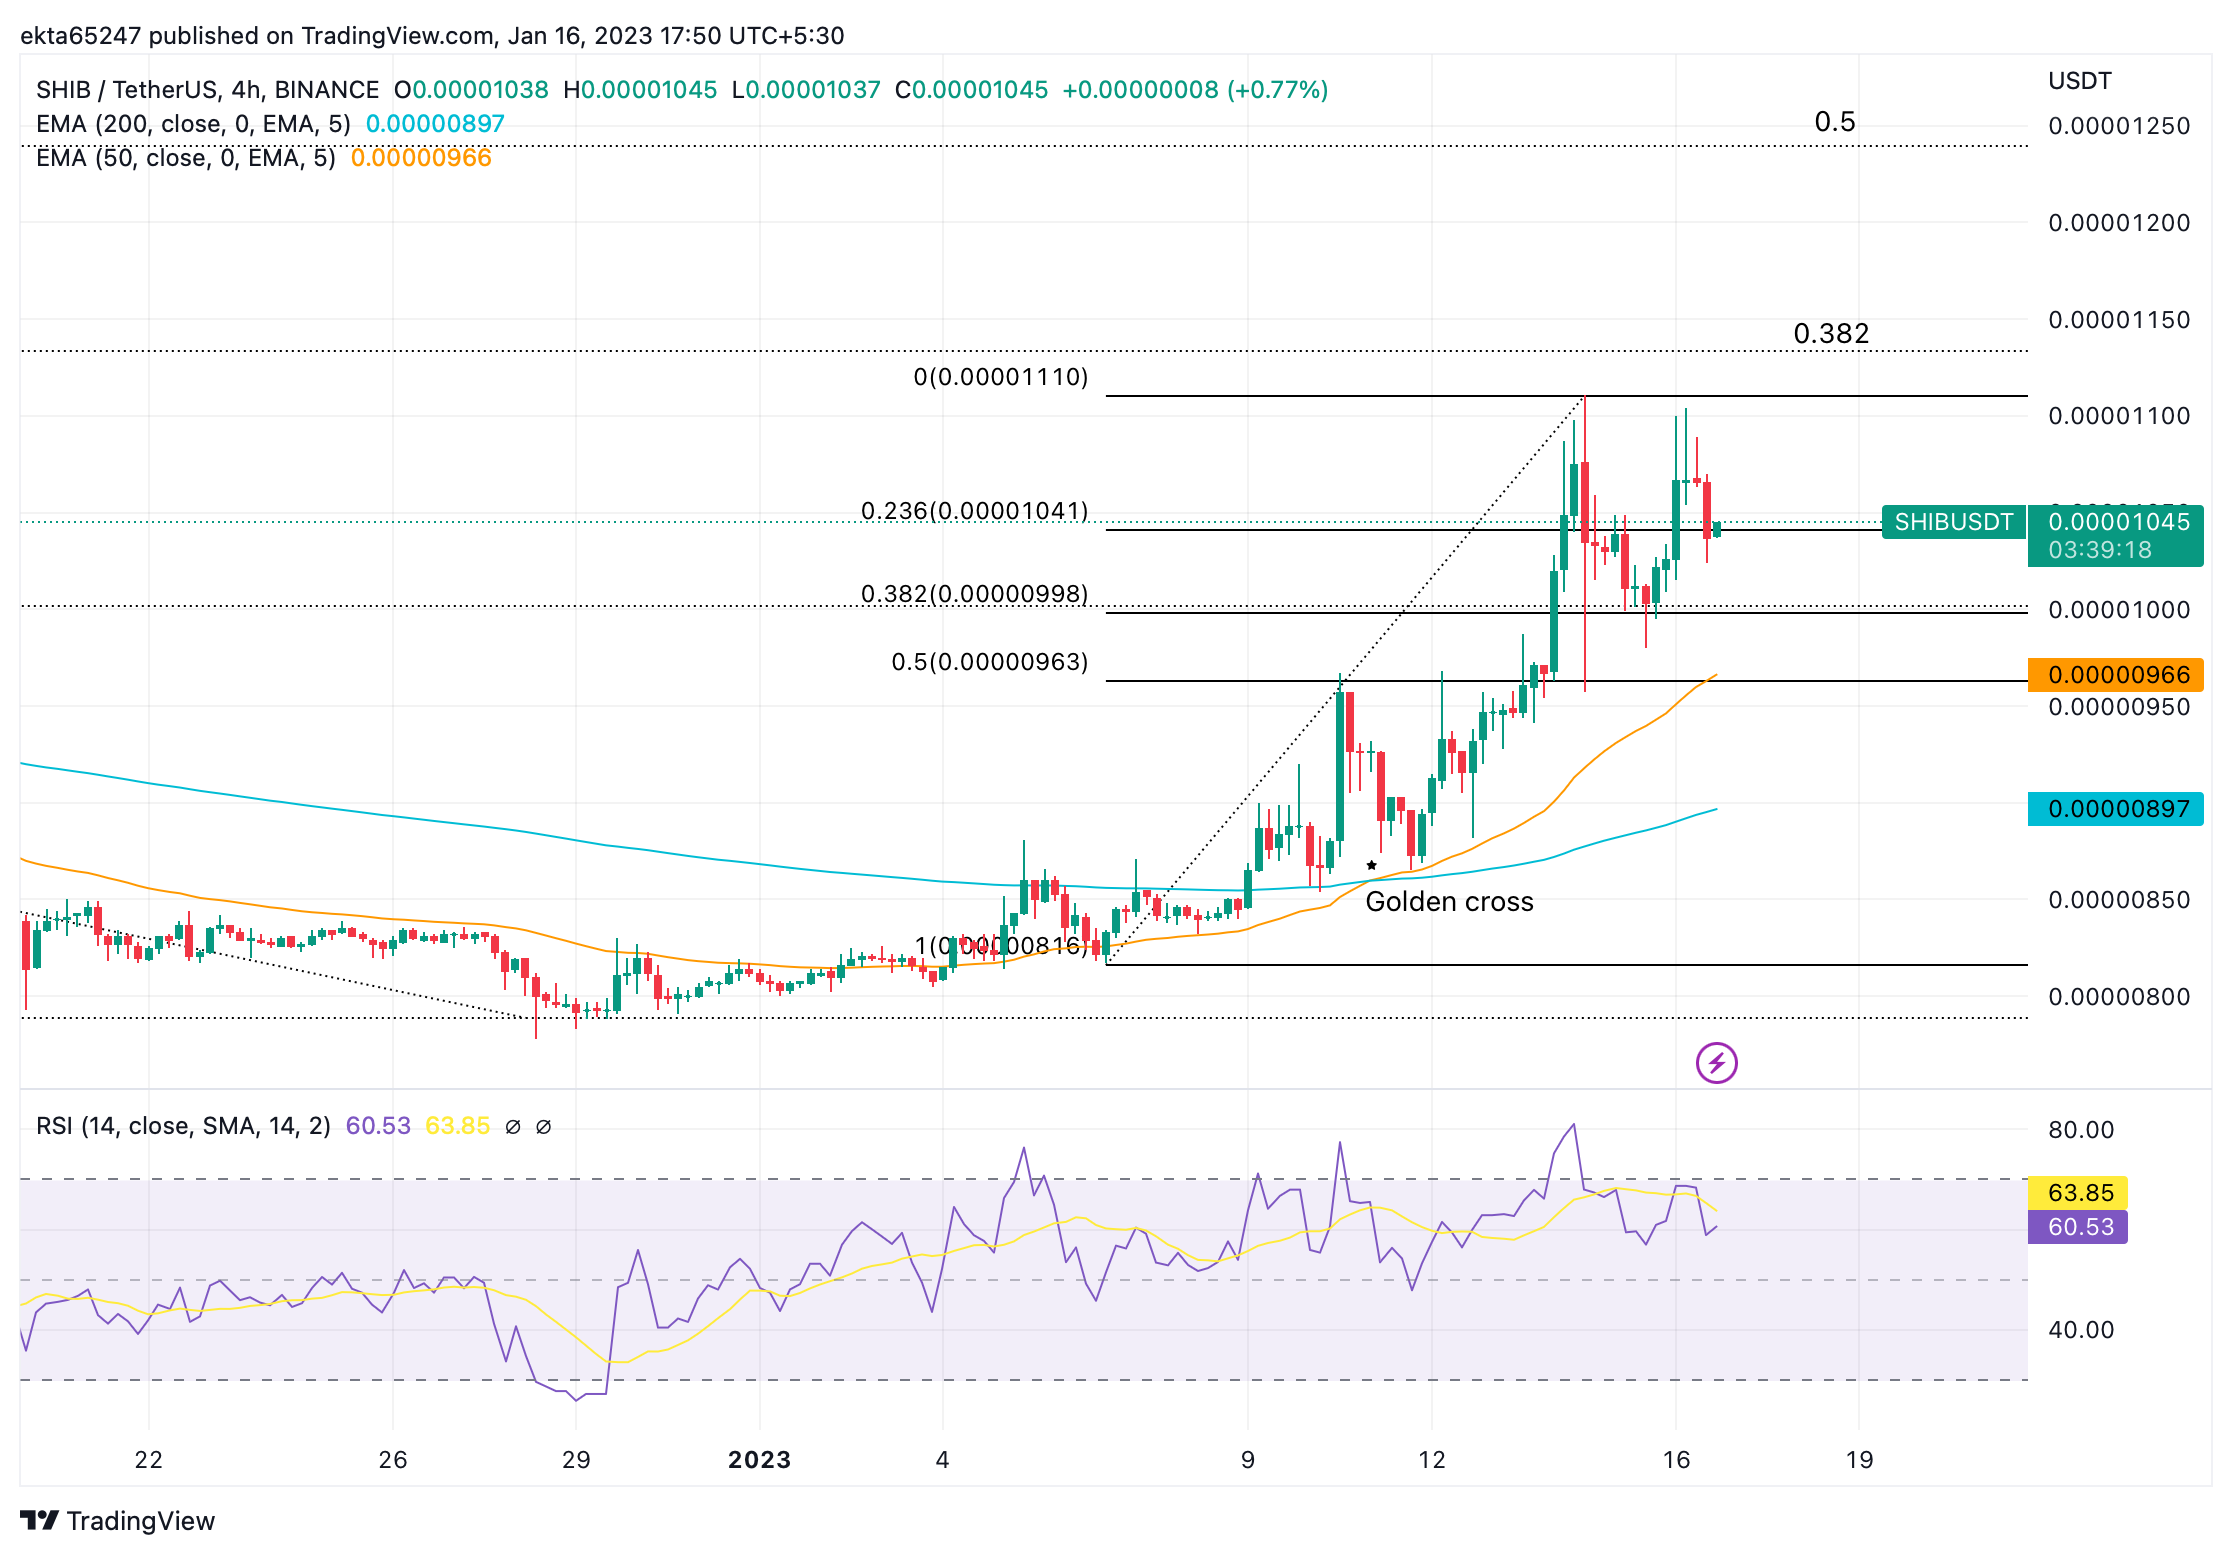
SHIB/USDT price chart
As seen in the chart above, SHIB is in a short term uptrend which is expected to continue rising in the absence of reversal insignia. The Relative Strength Index (RSI), a momentum indicator, reads 60.53 which is still not in overbought territory, suggesting there is scope for more upside. The two indicators, the Golden Cross on the SHIB price chart, where the 50-day Exponential Moving Average (EMA) crosses over the 200-day EMA, and the RSI signal bullish potential in Shiba Inu.
The Dogecoin-killer could climb higher, if the meme coin bounces from the 23.6% Fibonacci retracement level.
A breakdown below the Jan 15 low at $0.00000980 of would endanger the uptrend, however, and indicate a possible reversal of the trend lower.
Author

Ekta Mourya
FXStreet
Ekta Mourya has extensive experience in fundamental and on-chain analysis, particularly focused on impact of macroeconomics and central bank policies on cryptocurrencies.


