Top 3 Price Prediction Bitcoin, Ethereum, Ripple: Crypto Season coming close to the end
- Bitcoin price could show an early reversal signal by breaching 20,900.
- Ethereum price maintains its strength despite recent selling pressure.
- XRP price shows bearish cues within the congestion zone.

The cryptocurrency market is experiencing turbulence near the upper bounds of the recent rally. As the price descends, traders question whether the market will rebound toward higher prices or if the profitable bull run has already ended.
Bitcoin price takes a hit
Bitcoin price is down 2% on the day as the digital currency has been rejected from the $23,000 zone. The 8-day exponential moving average crosses over the 21-day simple moving average, suggesting a volatile downswing is within reach.
Bitcoin price is currently trading at $22,509. The relative strength index holds the key to interpreting Bitcoin's potential. Throughout the winter, as the price ascended back into the $20,000 zone, the RSI did breach overbought conditions, suggesting that any pullback could be viewed as a buying opportunity. However, if the RSI falls below 40, buying Bitcoin at its current price would be riskier. At the time of writing, BTC still has room to fall, as the RSI is positioned at the 50 levels.
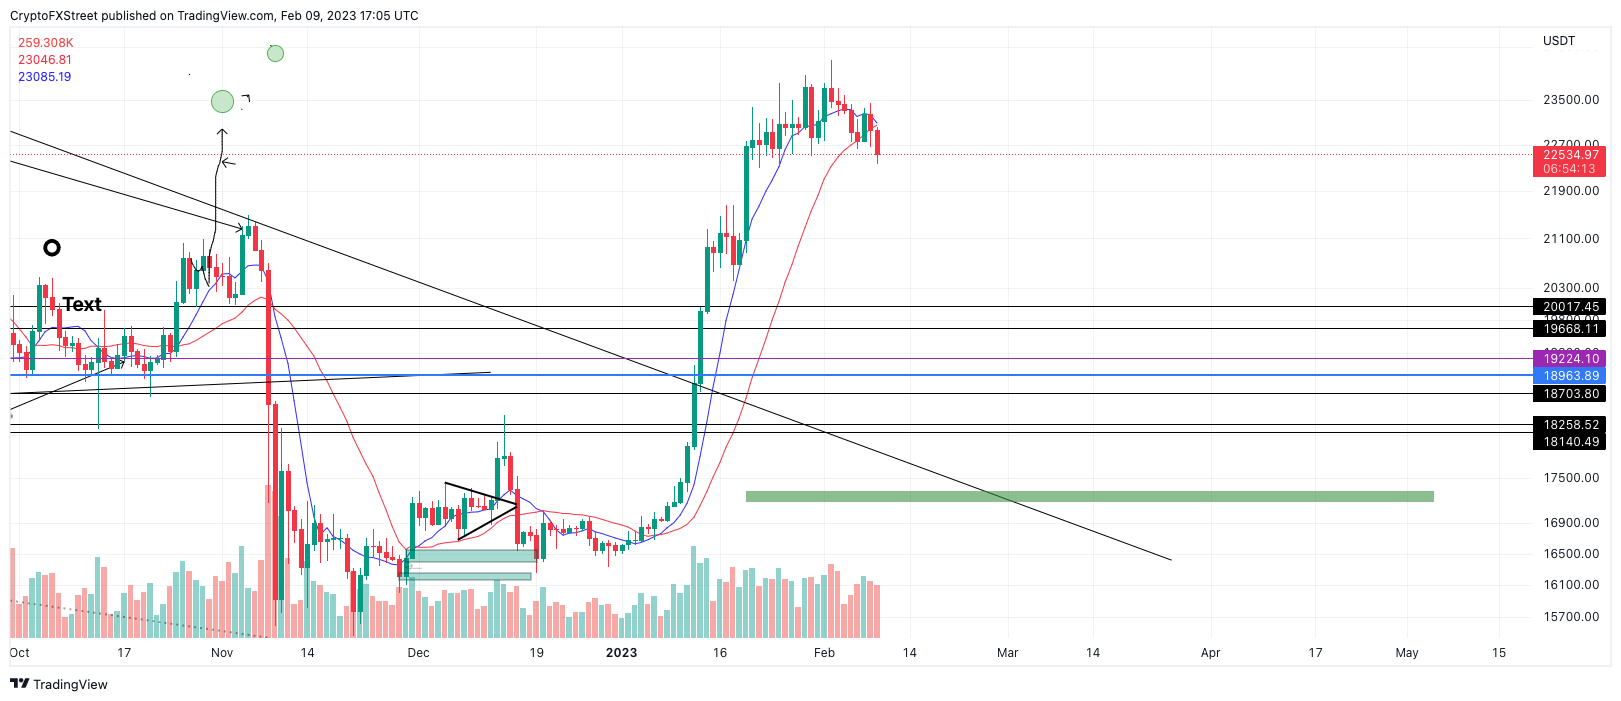
BTC/USDT 1-Day Chart
Traders should also beware that the strongest bullish candlestick within the winter rally began at $20,900. If the price falls below this level, it would also constitute a reversal signal, meaning the entirety of the uptrend that started at $15,476 would be in jeopardy. At the time of writing, Bitcoin price is only 7% above the critical $20,900 level, thus, traders should be vigilant during the next few trading days.
Ethereum price uptrend is intact
Ethereum price is maintaining its’ bullish strength despite recent selling pressure. On February 9, the decentralized smart contract token was down 1.5% but seems unfazed, as support has continuously come at higher levels within the $1600 range.
Ethereum price is currently trading at $1626 and is still finding support from the 21-day simple moving average. Traders should understand that a daily candlestick near the barrier would likely induce a steeper decline. The first key level of interest would be the $1490 resistance level, resulting in a 7% decline.
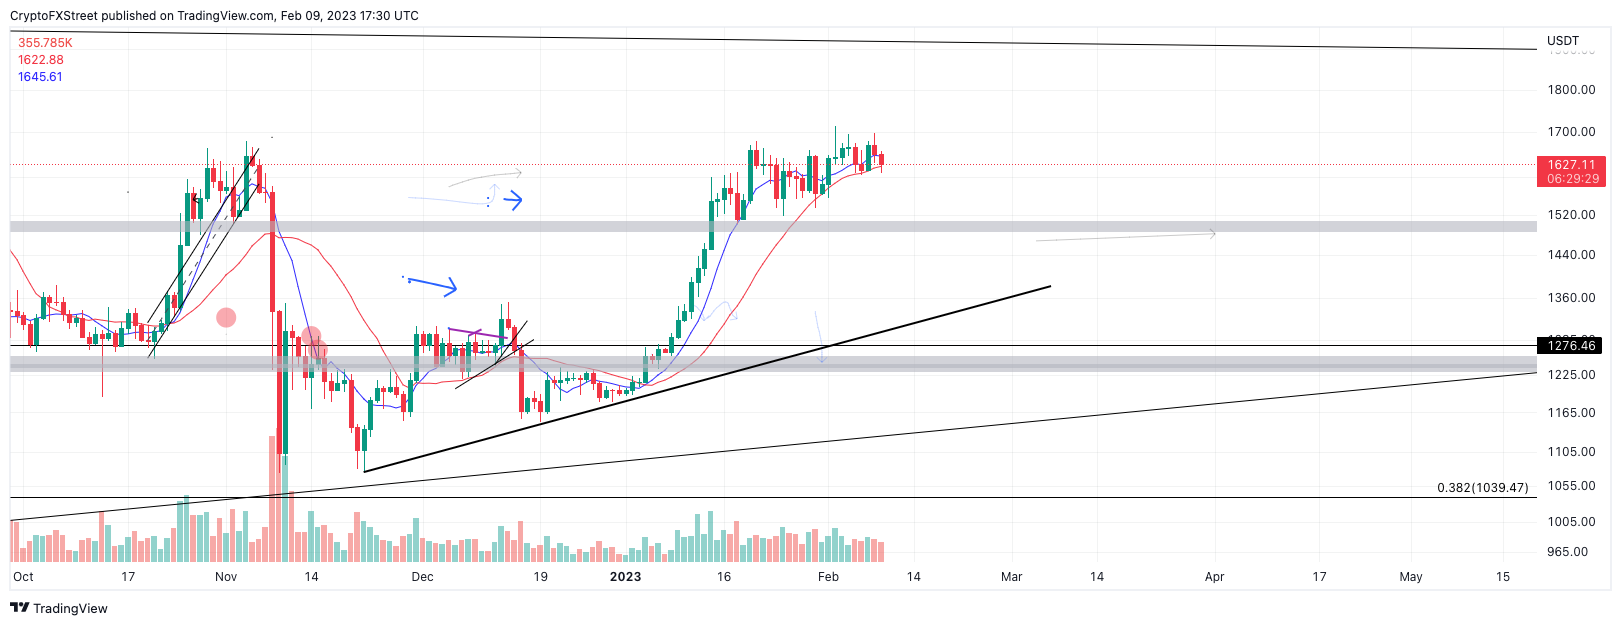
ETH/USDT 1-Day Chart
Still, the ascending support fits under a ramping 1-2-1-2 pattern, which is common for cryptocurrencies before a rally. If the pattern holds, ETH is 14% on pace to rally towards the $1850 zone. The bullish scenario creates the potential for a 14% increase in market value.
XRP price shows congestion
XRP price continues to underperform, as the digital currency has established a new low within the three-week consolidation. On February 9, the bears briefly tagged the 0.385 level, breaching liquidity beneath the prior week'sweek's swing low at $0.3860.
XRP price is currently trading at $0.3965. Although the price changes are minute in percentage, the overall market structure is stair-stepping south, which could signify a ramping 1-2-1-2 pattern to the downside. If this is the case, XRP could decline toward the mid-$0.35 zone.
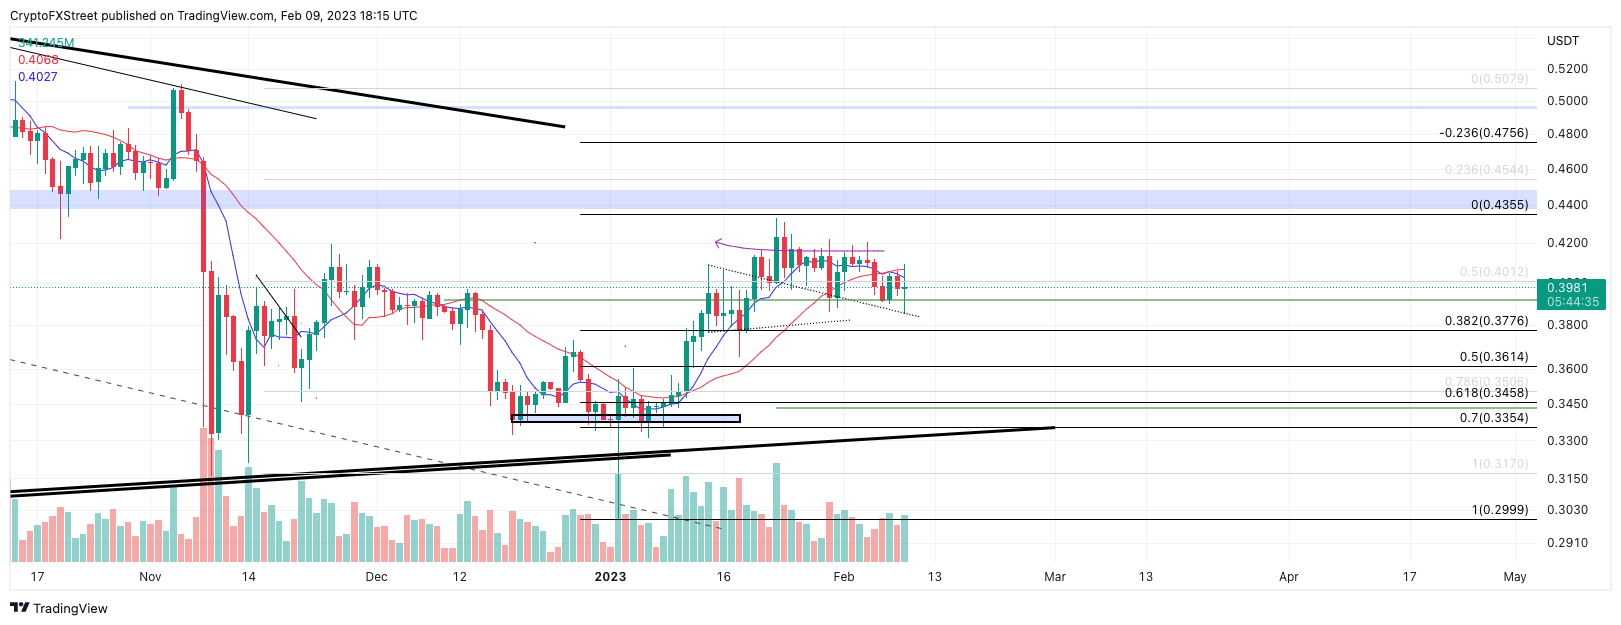
XRP/USDT 1-Day Chart
Invalidation of the bearish thesis could arise from a hurdle above the swing high marked at $0.41. If the breach occurs the bulls would likely re-route north toward the broken support zone at $0.44, resulting in a 14% increase from XRP’s current market value
Author

Tony M.
FXStreet Contributor
Tony Montpeirous began investing in cryptocurrencies in 2017. His trading style incorporates Elliot Wave, Auction Market Theory, Fibonacci and price action as the cornerstone of his technical analysis.


