Hedera Hashgraph Price Prediction: Nine days of consecutive decline has investors weary
- Hedera Hashgraph price has been trending downwards for nine consecutive days.
- The decline may continue toward the $0.053 zone.
- A break above the $0.069 high could invalidate the bearish potential.
Hedera Hashgraph price is undergoing a strong profit-taking sell-off after witnessing an impressive rally this winter. Key levels have been defined to assess HBAR's next potential move.
Hedera Hashgraph price subject to more decline?
Hedera Hashgraph's price has been overcome by a strong bearish influence as the scalable smart contract token is now and its ninth day of consecutive decline. The weekly decline is down by 13%, and the technicals suggest more downtrend price action is possible.
Hederas Hashgraph (HBAR) price currently auctions at 0.069. A Fibonacci retracement tool surrounding the 2022 low at $0.036 and the year-to-date high (YTD) high at $0.09 shows that the recent downswing is just a 50% retracement. Elliott wave theory and Fibonacci analysis suggest that the uptrend witnessed this winter is still intact, as corrections are often found to bottom out near the 50% Fib level.
However, Relative Strength Index (RSI) argues a different case for Hedera that investors should be aware of. The recent downswing has breached oversold conditions, suggesting the entire uptrend rally is in jeopardy. A conservative target for bears to aim for next will be the 61.8% Fibonacci level marked at $0.053. The bearish scenario would result in a 15% decrease from HBAR's current market value.
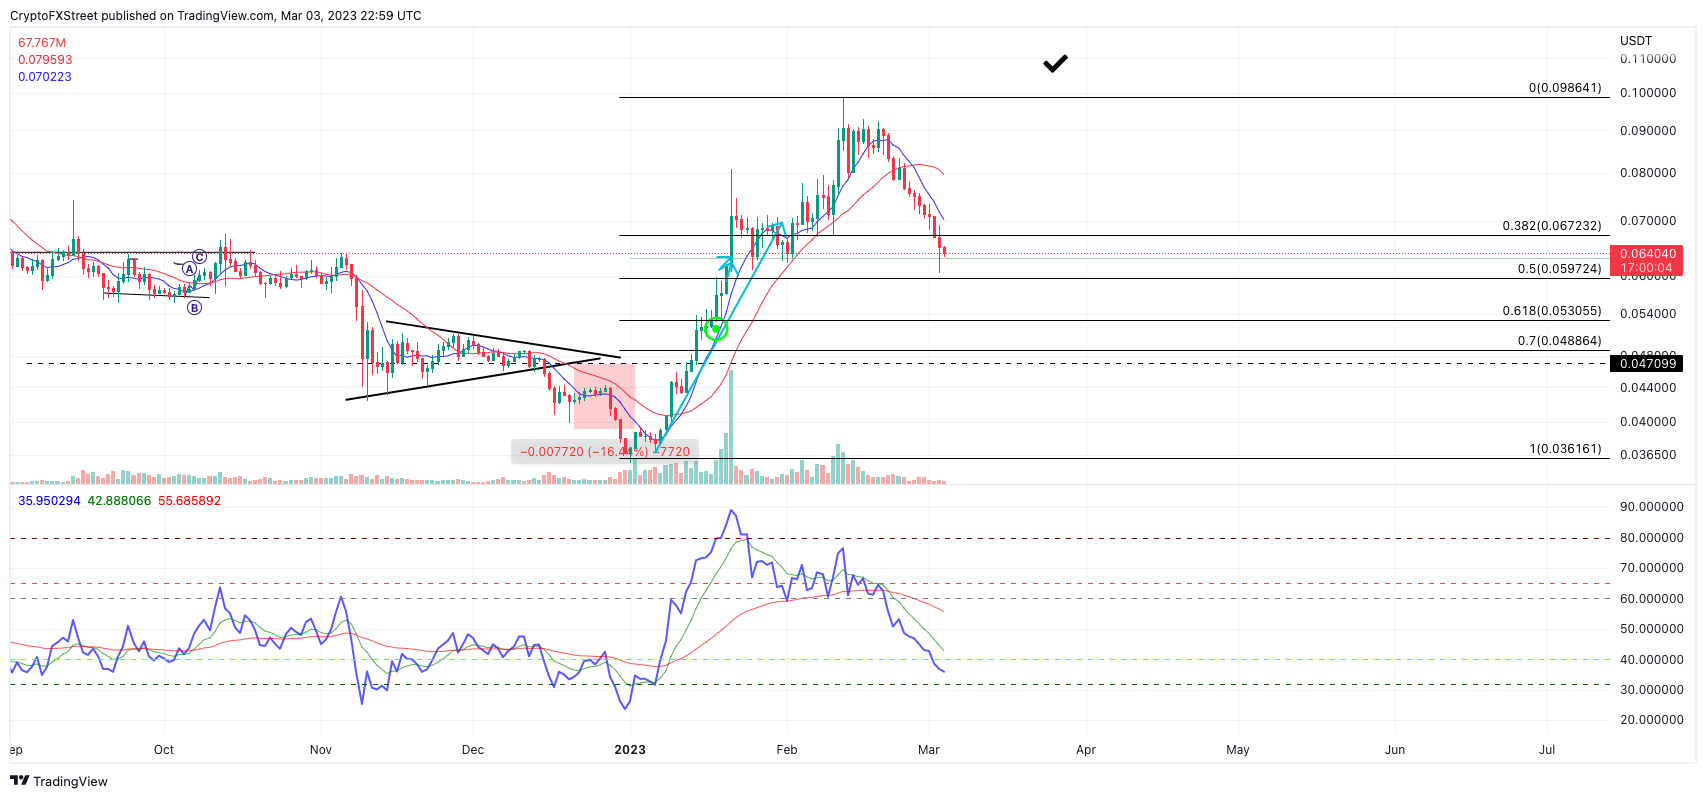
HBAR/USDT 1-Day Chart
Still, there is always a chance for a market reversal, especially near key Fibonacci levels. The earliest confirmation to suggest that the bottom of the correction is in would be a breach above the previous day's high at 0.069. if the bulls can hurdle the barrier, the winter rally, which rose HBAR by 171% in just 40 days, would be on pace to continue treading higher. A retest of the monthly high at $0.09 would be the first pitstop of expected resistance and would result in a 52% increase from the HBAR price today.
Author

Tony M.
FXStreet Contributor
Tony Montpeirous began investing in cryptocurrencies in 2017. His trading style incorporates Elliot Wave, Auction Market Theory, Fibonacci and price action as the cornerstone of his technical analysis.


