Hedera Hashgraph Price Prediction: HBAR targets $0.10
- Hedera Hashgraph price consolidates after rising 77% during January.
- HBAR could a rally and challenge the $0.10 liquidity zone
- Invalidation of the uptrend thesis could occur from a breach below $0.061.

Hedera Hashgraph price is still in an uptrend until further evidence is displayed. Traders should continue following the trend while maintaining healthy risk management.
Hedera Hashgraph price points higher
Hedera Hashgraph price maintains its bullish stance as a consolidated range is forming near the upper bounds of a newfound uptrend. The shallow pullback is a positive gesture that early buyers are holding on to their positions, and if the market is genuinely bullish, HBAR could be embarking on a much larger macro uptrend.
Hedera Hashgraph price currently auctions at $0.064, going on its 11th day of trading within a converging range after rallying 77% in January. At the time of writing, the scalable smart contract token auctions above both the 8-day exponential moving average and 21-day simple moving averages.
The Relative Strength Index, a commonly used indicator to analyze market behavior based on past rallies, suggests that the current range may be returning to a previous resistance level. Additionally, there are bullish divergences present between the lows of $0.061 on January 18 and the recent swing low on February 1, which was at $0.062.
Considering these factors, the Hedera price seems poised to rally higher. The bulls may be able to induce a rally towards the $0.10 zone, which would result in a 58% increase from HBAR’s current market value. The target zone is an untested liquidity level that dates back to Q4 2022 when HBAR fell from $0.10 into the $0.04 lows.
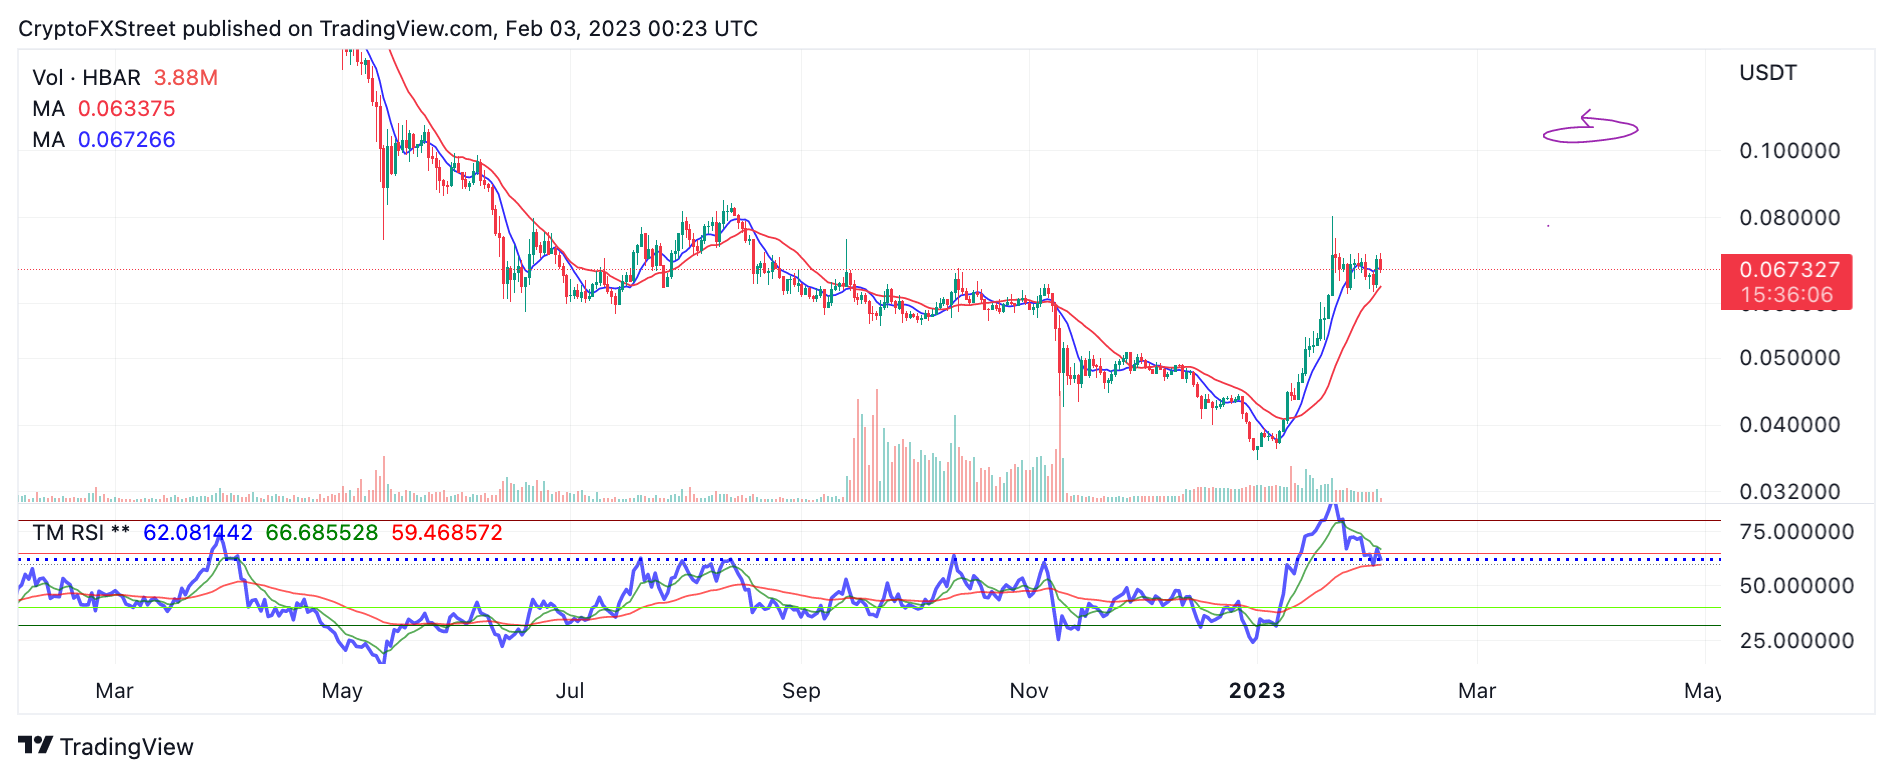
HBAR/USDT 1-day chart
The earliest signs of an uptrend failure potential would be a breach of the 21-day SMA marked as $0.061. A breach of this barrier could result in a steeper decline targeting the halfway point of the 70% rally. The bear scenario creates potential for a 30% decline targeting the $0.04 zone.
Author

Tony M.
FXStreet Contributor
Tony Montpeirous began investing in cryptocurrencies in 2017. His trading style incorporates Elliot Wave, Auction Market Theory, Fibonacci and price action as the cornerstone of his technical analysis.


