Hedera Hashgraph Price Prediction: HBAR's plan for 2023
- Hedera Hashgraph rallied by 117% since the start of the new year.
- A $0.10 HBAR could become a reality if market conditions persist.
- A breach of the trend at $0.06 could signal an end to the rally.

Hedera Hashgraph price going parabolic
Hedera Hashgraph price continues to bless loyal investors as the scalable smart contract token has rallied by 117% since the start of the new year. On January 26, HBAR hovers in the mid $0.06 zone as a profit-taking rally occurred following the newly established monthly high at $.081. Despite the bearish presence near the top of the trend, Hedera's technical suggests a much larger move could be underway.
Hedera Hashgraph price currently auctions at $0.066. The bears are testing the buyers' influence near the 8-day exponential moving average. The indicator has provided support on several occasions throughout the 117% rally and is expected to continue.
The Relative Strength Index (RSI) compounds this idea as the indicator returns to a previous resistance zone after breaching over-bought territory. The RSI pattern could be viewed as a buy signal for traders in profit to begin adding to their position.
The volume profile indicator also suggests the uptrend is healthy and poised for more games. On January 21, the bulls produced the largest green day of the year, rallying 30% into the new monthly high. The surge was accompanied by a 5 billion dollar influx of transactions. Since the massive spike, the profit-taking bears have only managed to produce $749 million in transactions on average in the last six days. That being said, it is likely that bulls in the market are holding on to their positions, confidently aiming for hire targets.
If the market is as bullish as it seems, the $0.08 resistance level is a high probability pit-stop for the HBAR rally. Ultimately Hedera Hashgrapgh price could rise towards $0.10, a liquidity zone left unchallenged since June's free-fall selloff.
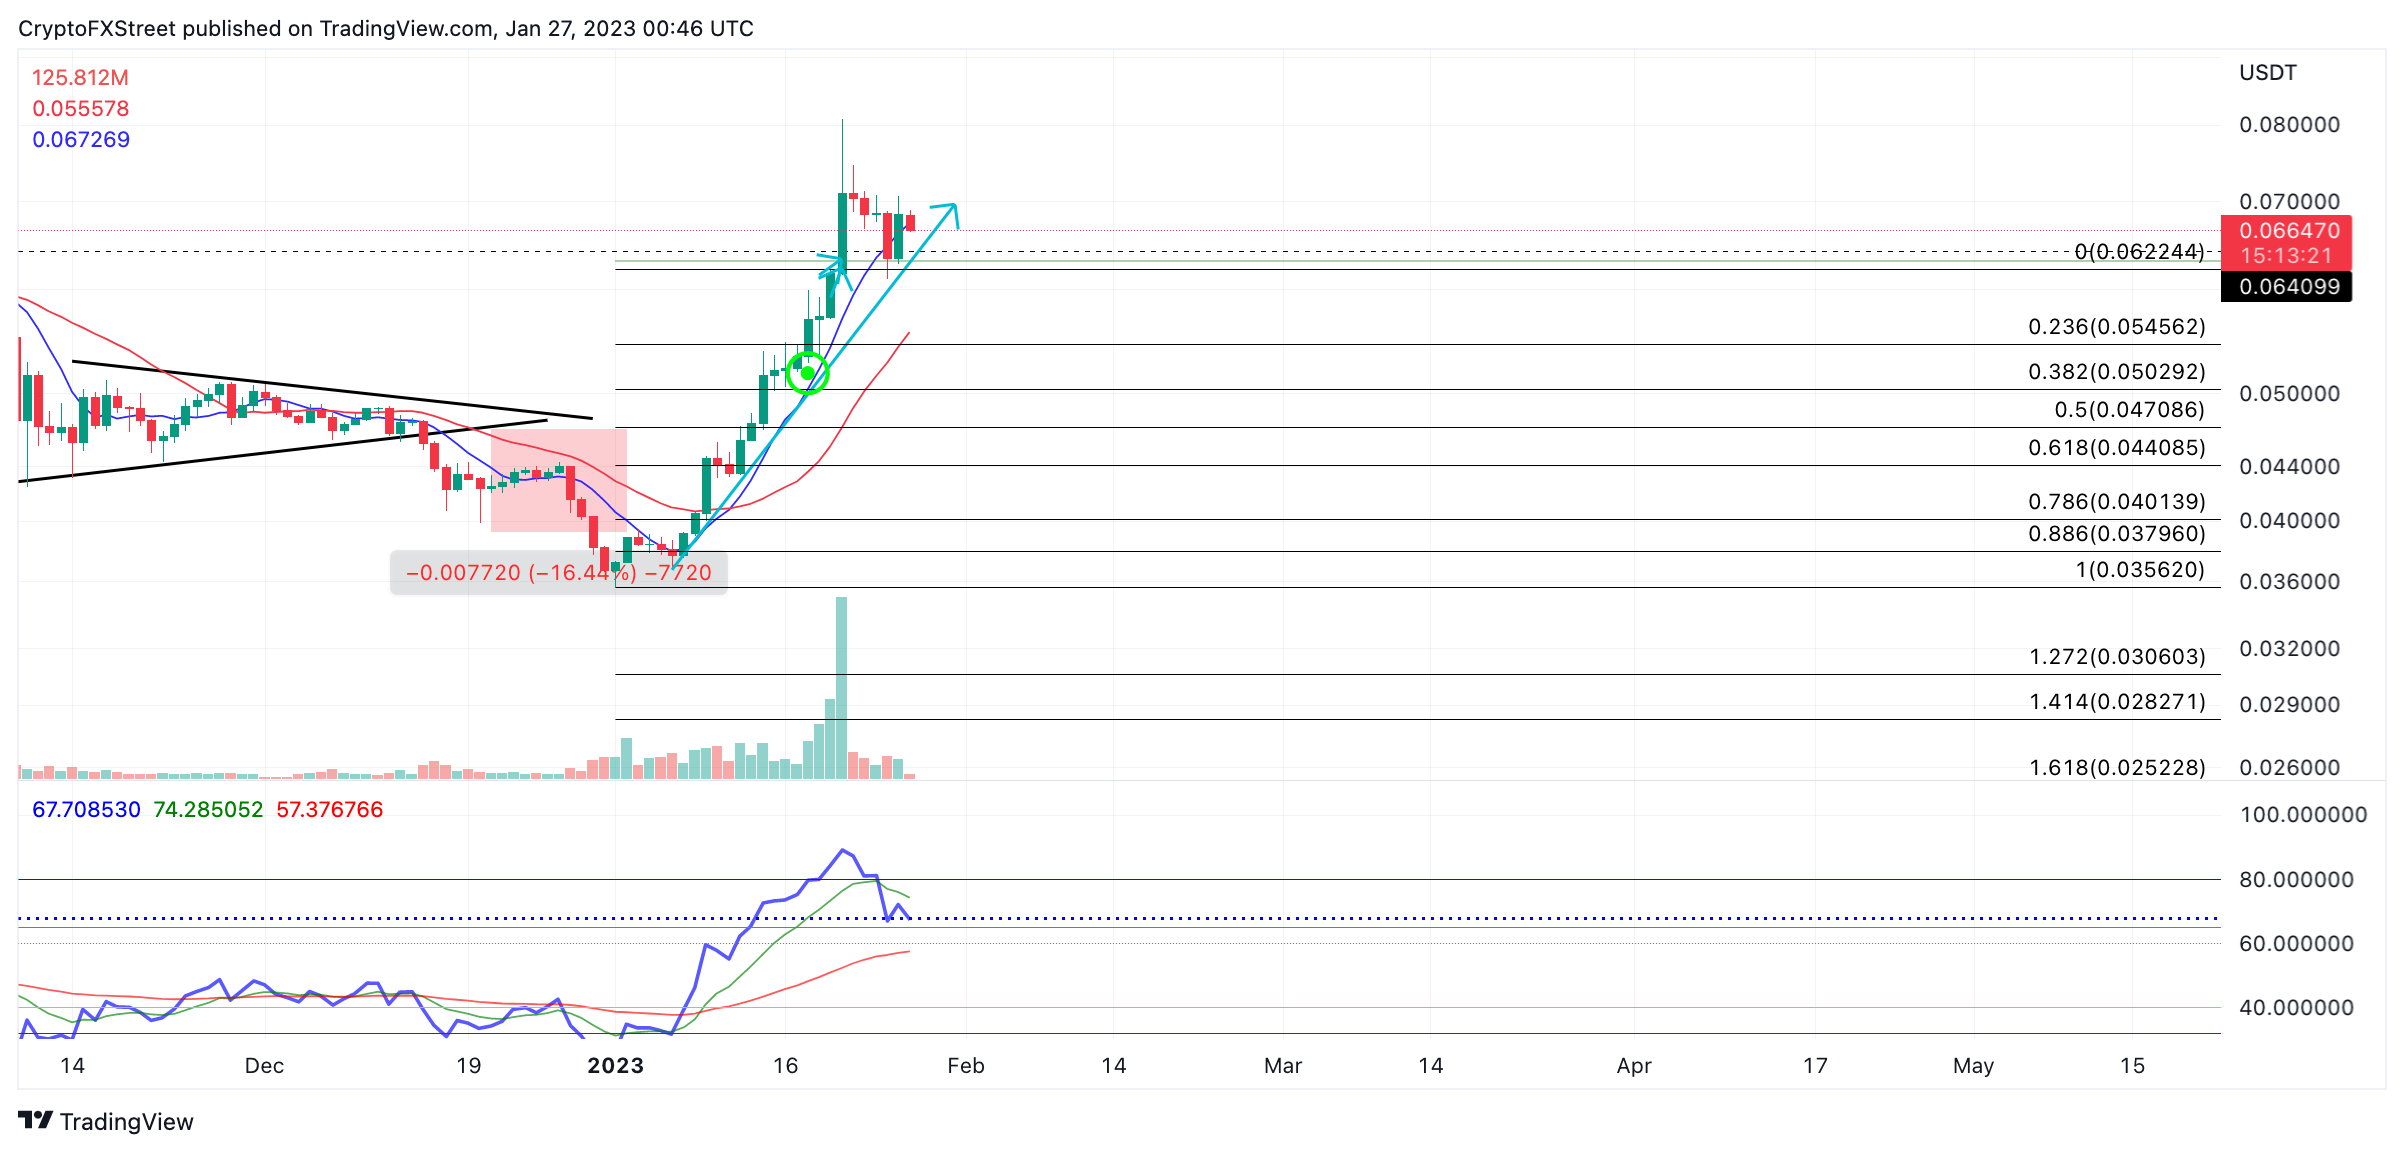
HBAR/USDT 1-Day Chart
Respecting the trend is highly advised for traders looking to join the market. A breach of the ascending trend line at $0.06 could be the end of the rally and could induce adownswing toward the midway point of the current trend near $0.04. Such a move would result in a 30% decline from HBAR's current market value if the bears were to succeed.
Author

Tony M.
FXStreet Contributor
Tony Montpeirous began investing in cryptocurrencies in 2017. His trading style incorporates Elliot Wave, Auction Market Theory, Fibonacci and price action as the cornerstone of his technical analysis.


