GMT price poised for a 10% rally as technical indicators signal bullish momentum
- GMT price broke above the downward channel pattern.
- Technical analysis shows that GMT has formed a bullish divergence on a momentum indicator.
- A daily candlestick close below $0.184 would invalidate the bullish thesis.

GMT price surged beyond the confines of its downward channel pattern, buoyed by a bullish divergence indicated by both the Relative Strength Index (RSI) and the Awesome Oscillator (AO), potentially paving the way for an upward rally.
GMT price looks promising
GMT price has produced three lower highs and three lower lows since June 7. Connecting these swing points using trend lines reveals a downward channel formation in the 4-hour chart.
GMT price broke out of the downward channel on June 12 and is currently supported by the upper boundary of the downward channel. If this support holds, then GMT price could rally 10% to tag $0.217, its 50% price retracement level drawn from a swing high of $0.249 on June 3 to a swing low of $0.184 on June 12.
The RSI and the AO support this bullish thesis. The lower low formed on June 12 does not reflect the RSI higher high for the same period. This development is termed a bullish divergence and often leads to the reversal of the trend or a short-term rally.
If the bulls are aggressive and the overall crypto market outlook is positive, then GMT could extend an additional rally of roughly 4% to tag the midpoint of the price imbalance at $0.225, formed between $0.216 and $0.234.
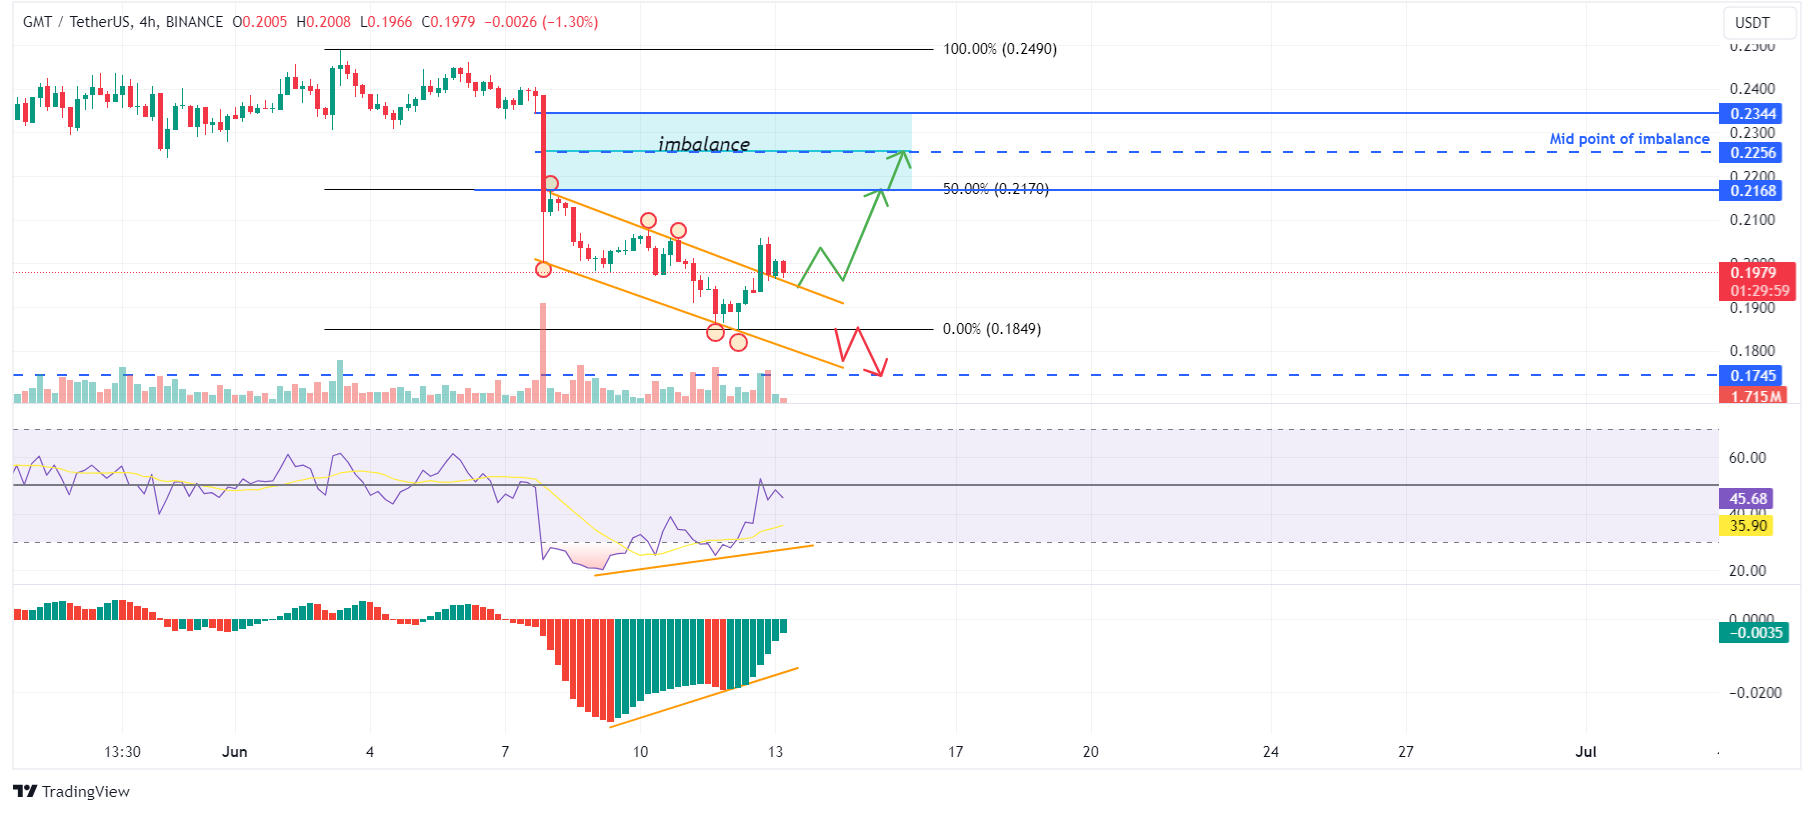
GMT/USDT 4-hour chart
However, if the GMT price produces a daily candlestick close below $0.184, it would produce a lower low in the daily time frame. Such a development would give rise to a bearish market structure. This change in market structure would invalidate the bullish thesis and catalyze a 6% crash in the GMT price to revisit the previous support level of $0.174.
Author

Manish Chhetri
FXStreet
Manish Chhetri is a crypto specialist with over four years of experience in the cryptocurrency industry.


