Top 3 Price Prediction Bitcoin, Ethereum, Ripple: BTC likely to take markets on a rollercoaster

Most recent article: Top 3 Price Prediction Bitcoin, Ethereum, Ripple – Bitcoin could see high volatility due to US CPI
- Bitcoin price broke out of a symmetrical triangle pattern and remains above throwback support.
- Ethereum price is likely to have a pullback into its major support area between $3,400 and $3,200.
- Ripple price holds the daily support level at $0.467.
Bitcoin (BTC) price is trading with a bullish bias following a successful breakout and retest of a symmetrical triangle pattern. Ripple (XRP) also follows in BTC’s footsteps as it continues to hold on to its major support level. Ethereum (ETH) price, on the other hand, shows signs of an impending correction.
Bitcoin price eyes for a 7% rally
Bitcoin price broke out of the symmetrical triangle pattern on June 4, which was formed by connecting the three lower highs and three higher lows, formed since May 19 using trend lines. The breakout, however, was rejected by the weekly resistance around the $71,280 level.
Currently, BTC finds support around the upper boundary of the symmetrical triangle pattern around the $68,500 level.
If this support holds, then BTC could rally 7% to its all-time high of $73,777.
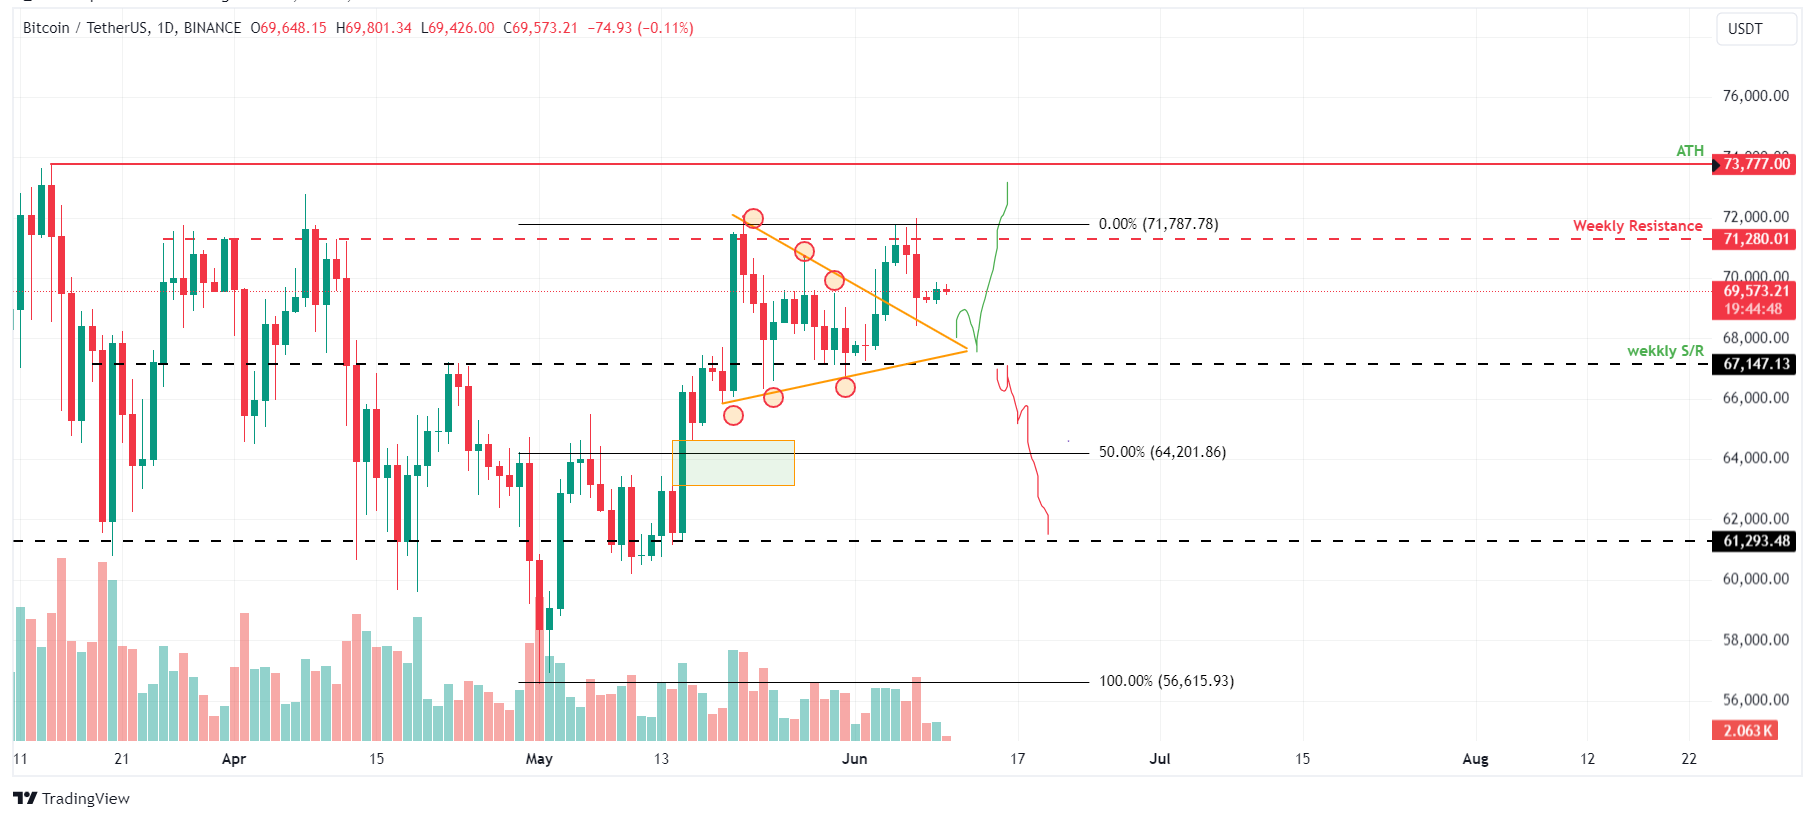
BTC/USDT 1-day chart
However, if BTC breaks below the lower boundary of the triangle and closes below $67,147, the bullish thesis could be invalidated, leading to an 8% crash to its daily support level of $61,293.
Ethereum price looks promising
Ethereum price broke above a falling wedge pattern on the daily chart on May 20, leading to a 21% rally. However, it is encountering resistance from a bearish order block established on March 12, which ranges from $3,980 to $4,093, posing a challenge for ETH bulls.
Investors considering buying ETH should watch the following levels:
- The 50% retracement level at $3,424, calculated from the swing high of $3,984 on May 27 to the swing low of $2,864 on May 13.
- The 61.8% Fibonacci retracement level at $3,279 from the same movement.
If the conditions mentioned above play out, then the Ethereum price could revisit its previous resistance level at $4,000.

ETH/USDT 1-day chart
Conversely, if Ethereum's daily candlestick closes below the $2,864 level, it would create a lower low and indicate a disruption in the market structure. This development would negate the previously discussed bullish outlook and could potentially lead to an additional 9% decline, reaching the prior support level of $2,600.
Ripple price finds support on a major level
Ripple price bounces off from its daily support level of around $0.467 on Friday.
If the daily support at $0.467 support holds, XRP could move to the upside and retest its previous resistance level at $0.571.
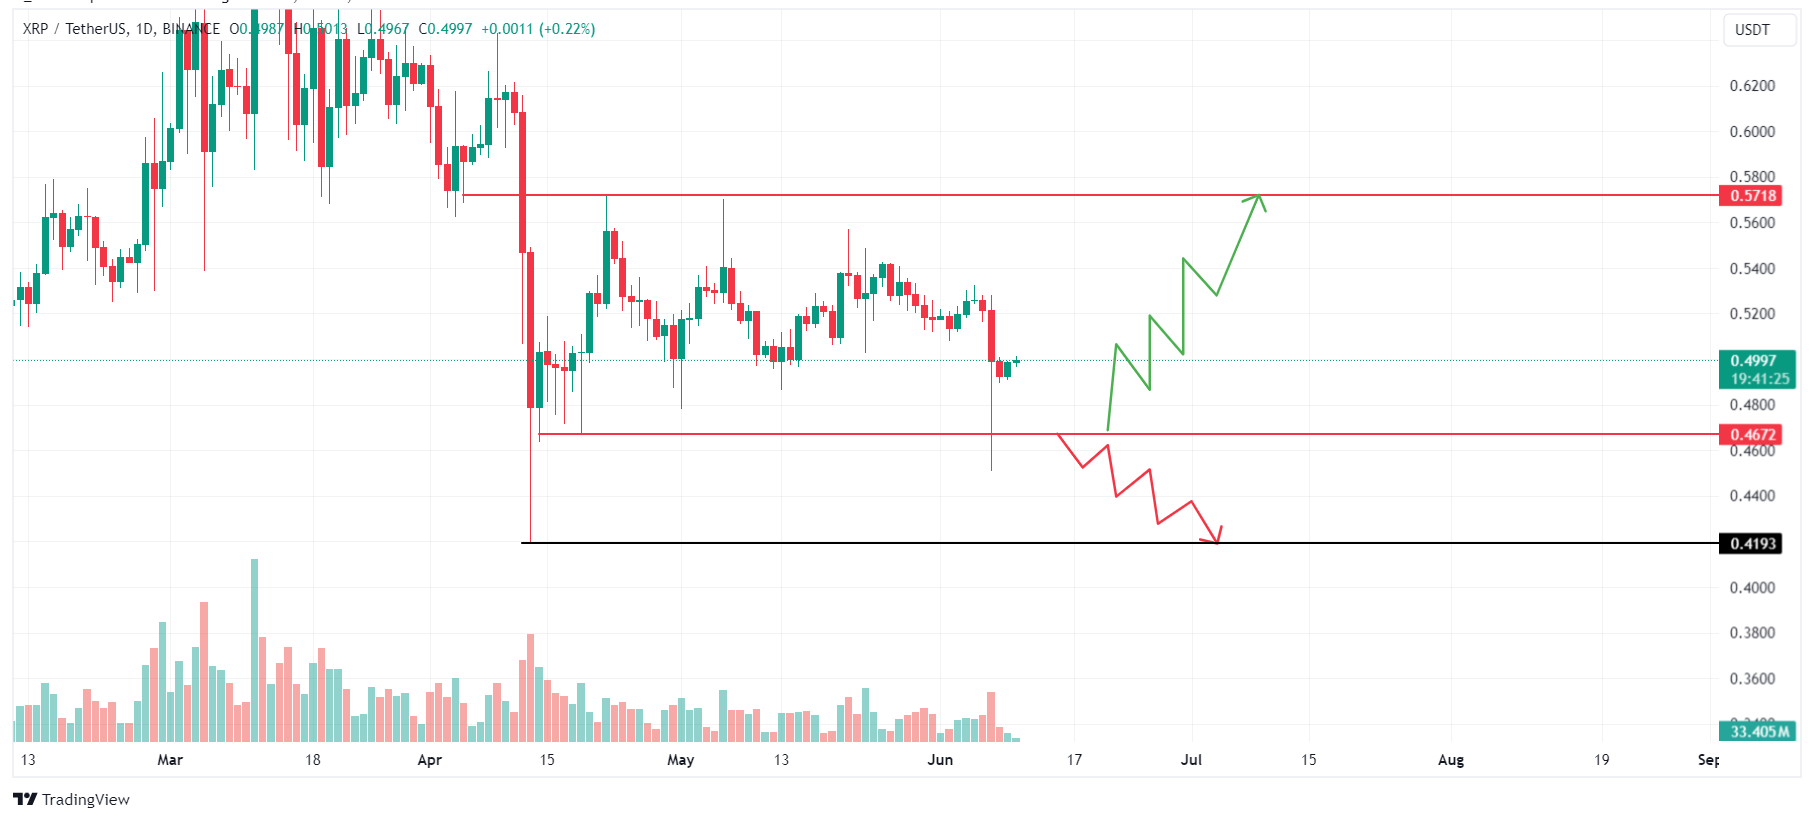
XRP/USDT 1-day chart
However, if the Ripple daily candlestick closes below $0.467, then XRP could crash an additional 10% to its previous support at $0.419.
Author

Manish Chhetri
FXStreet
Manish Chhetri is a crypto specialist with over four years of experience in the cryptocurrency industry.


