Four reasons why XRP price will reach $1
- XRP price shows a bullish view from a technical standpoint, hinting at a revisit of $1.
- On-chain metrics, however, represent a more ambiguous outlook.
- A daily candlestick close below $0.60 will invalidate the bullish thesis for Ripple.

XRP price has been in a downtrend since March 28 and this move has been exacerbated by the flash crash in Bitcoin price. After finding its feet and then bouncing off a buy zone, the remittance token has restarted its uptrend.
XRP price reveals a light at the end of the tunnel
XRP price action has flipped from being bullish to bearish – following the achievement of a local top at $0.93, on March 28, the remittance token has crashed 26%, straight into a buy zone extending from $0.62 to $0.68.
So far, a bounce off this area has pushed Ripple up by 9% and is grappling with the 50% retracement level at $0.73. A significant hurdle in sight, is the 2022 volume point of control at $0.77. This area is where the most volume for Ripple was traded since the start of 2022 and is therefore likely to provide support and resistance. Nevertheless, XRP price broke below it during the recent flash crash.
A quick recovery above this barrier, therefore, would be a favorable sign to bulls wishing to restart the uptrend.
Even so, for more gains XRP price will still need to mow through the $0.85 and $0.91 hurdles. Clearing these blockades will open the path for a retest of the $1 psychological level.
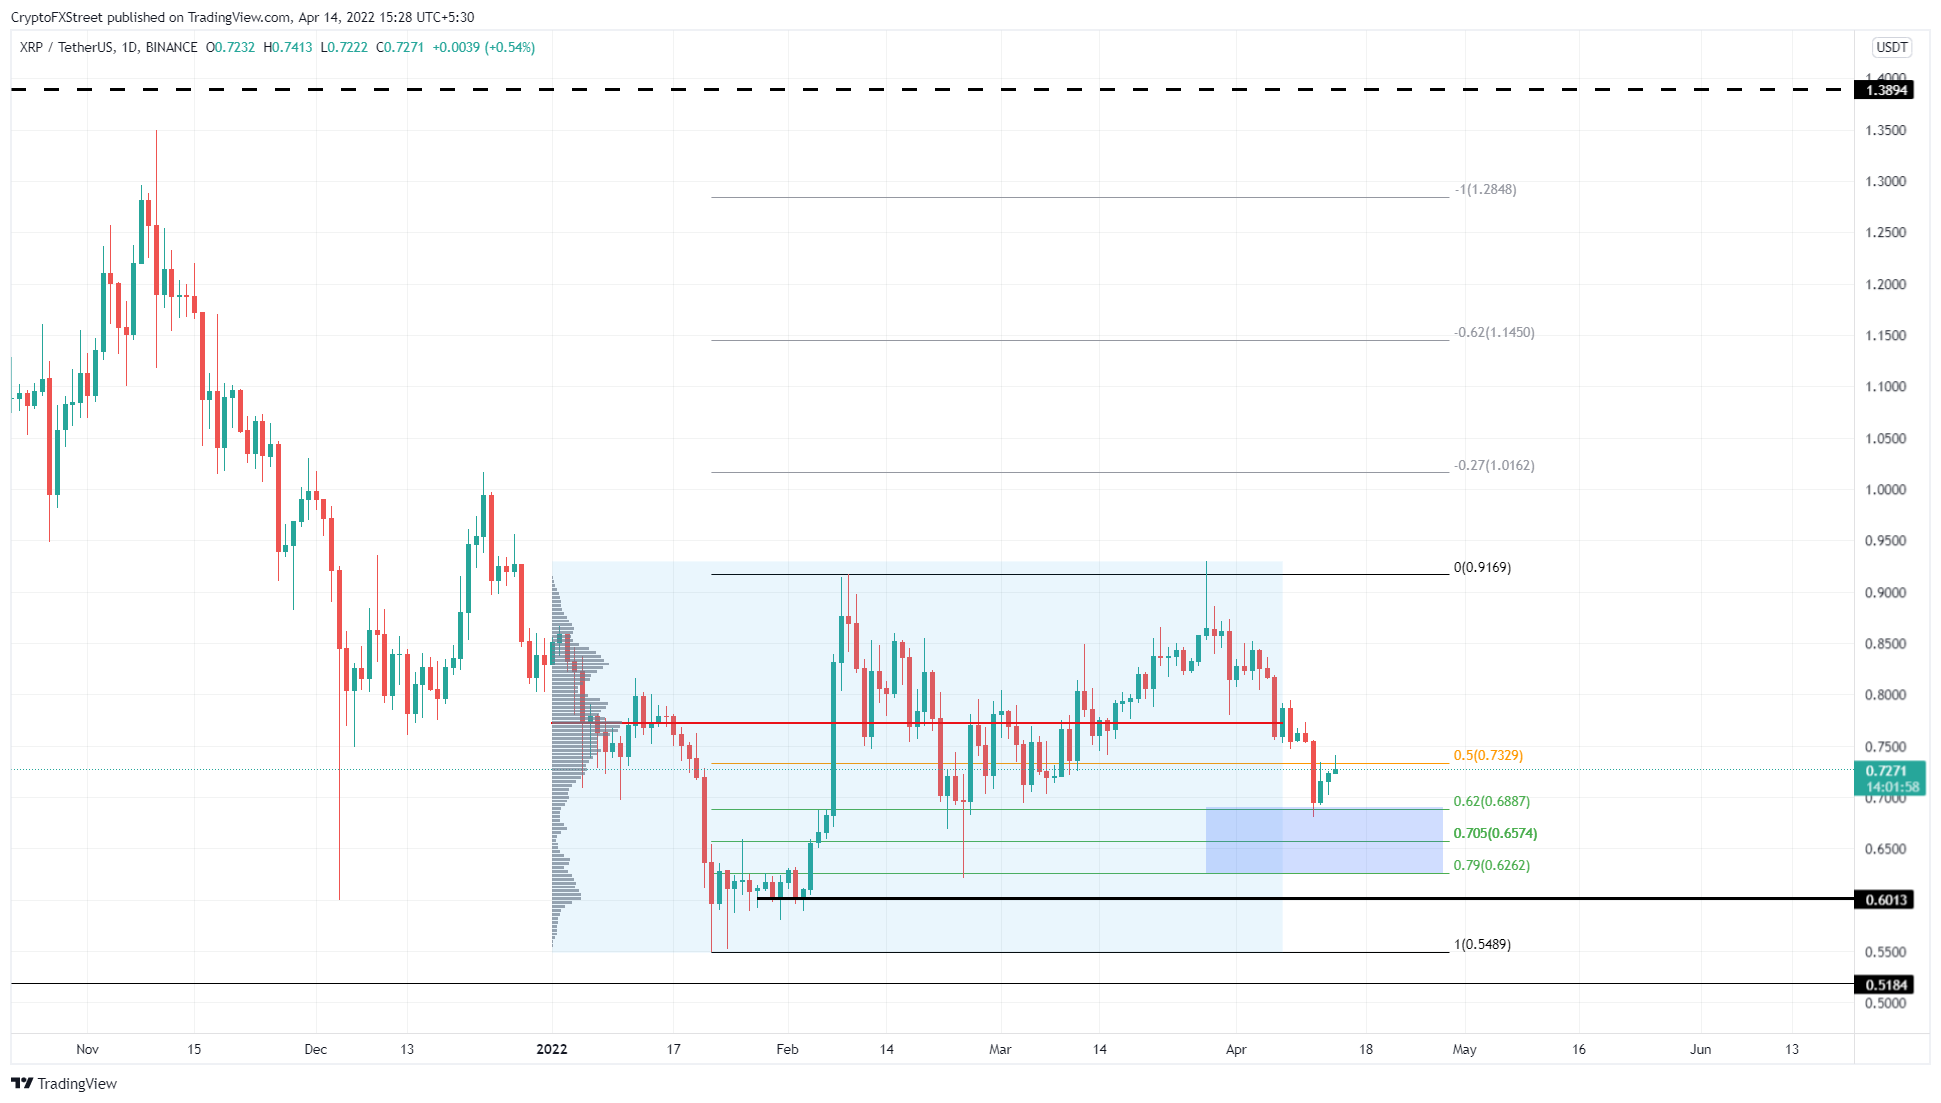
XRP/USDT 1-day chart
The only on-chain metric that shows clear bullish signs for XRP price is the 365-day Market Value to Realized Value (MVRV). This on-chain metric is used to determine the average profit/loss of investors that purchased XRP over the past year.
Currently, this index is hovering around -22%. It is at the same level where XRP price formed a local bottom in late January. The resulting uptrend then caused the remittance token to rally by nearly 53% in just roughly two weeks.
If history repeats itself, there is a good chance for the XRP price to kick-start a similar upswing.
 [08.08.00, 14 Apr, 2022]-637855271012227761.png)
XRP 365-day MVRV
The supply distribution for XRP price shows a negative correlation between the wallets holding 100,000 to 1 million and 10 million or more XRP tokens. The former category hit a peak of 9.9% on December 24, while the latter category was at 72%.
Since then, the group of wallets holding relatively smaller tokens has been on the decline and is currently hovering around 9.5% while the other set of holders has increased their holdings to 73.1%.
To sum it up, the whales holding 10 million or more XRP tokens have increased their market share, indicating that they are bullish on the token. While the other category has reduced its holdings suggesting that this group of holders is not as bullish as the other.
 [08.07.23, 14 Apr, 2022]-637855271149796473.png)
XRP supply distribution
Finally, we have the daily active addresses and the on-chain volume, both of which have been in a decline since February 8, suggesting that there has been an outflow of capital and investors interacting with the Ripple blockchain.
 [08.08.18, 14 Apr, 2022]-637855271212156738.png)
XRP daily active addresses vs on-chain volume
Regardless of the bullish scenario presented by a few on-chain indices, a daily candlestick close below $0.60 will invalidate the bullish thesis for Ripple. In such a case, XRP price could crash lower and tag the range low at $0.55 before reestablishing a directional bias.
Author

Akash Girimath
FXStreet
Akash Girimath is a Mechanical Engineer interested in the chaos of the financial markets. Trying to make sense of this convoluted yet fascinating space, he switched his engineering job to become a crypto reporter and analyst.



