Four reasons why Polkadot price will double by end of October
- Polkadot price is in for a massive run-up as two technicals point to a bullish outlook.
- The recent swing lows combined with the RSI show the formation of hidden bullish divergence, adding a tailwind to the optimistic scenario.
- The adoption of DOT by FCA registered digital asset custodian Digivault adds credence to the positive outlook.

Polkadot price has been stuck in a consolidation phase for roughly a month. However, this trend might be coming to an end due to three significant reasons. As a result, investors can expect DOT to start a massive bull rally over the coming month.
Technicals point to an inevitable uptrend for DOT
Polkadot price formed the first swing low at $25.21 on September 8 and rallied roughly 53% to create a swing high at $38.76, coinciding with the 70.5% Fibonacci retracement level.
Since the buyers could not maintain their bullish momentum, DOT retraced to erect the second swing low around the same as the first one at $25.21. The resulting run-up set up a lower high at $33.61 and corrected to form the third swing low a little higher than the previous two at $26.13.
These three swing lows are what is known as a triple-bottom pattern or a triple-tap setup. This technical formation is similar to the double-bottom reversal pattern, which often marks the end of a downtrend and kick-starts a new uptrend.
The second significant reason for this optimism is the green ‘one’ buy signal flashed by the Momentum Reversal Indicator (MRI) on the 12-hour chart.
This technical formation forecasts that the bottom is in and that a one-to-four candlestick upswing is likely.
Therefore, market participants can expect Polkadot price to climb past the recent swing high at $33.61 and make a run at the 70.5% Fibonacci retracement level at $38.30.
If the bid orders continue to pile up, pushing Polkadot price to produce a decisive 12-hour candlestick close above the 79% Fibonacci retracement level at $41.68, it will hint at the uptrend’s continuation.
In this bullish situation, DOT could ascend to the range high at $50.04, constituting a 100% gain.
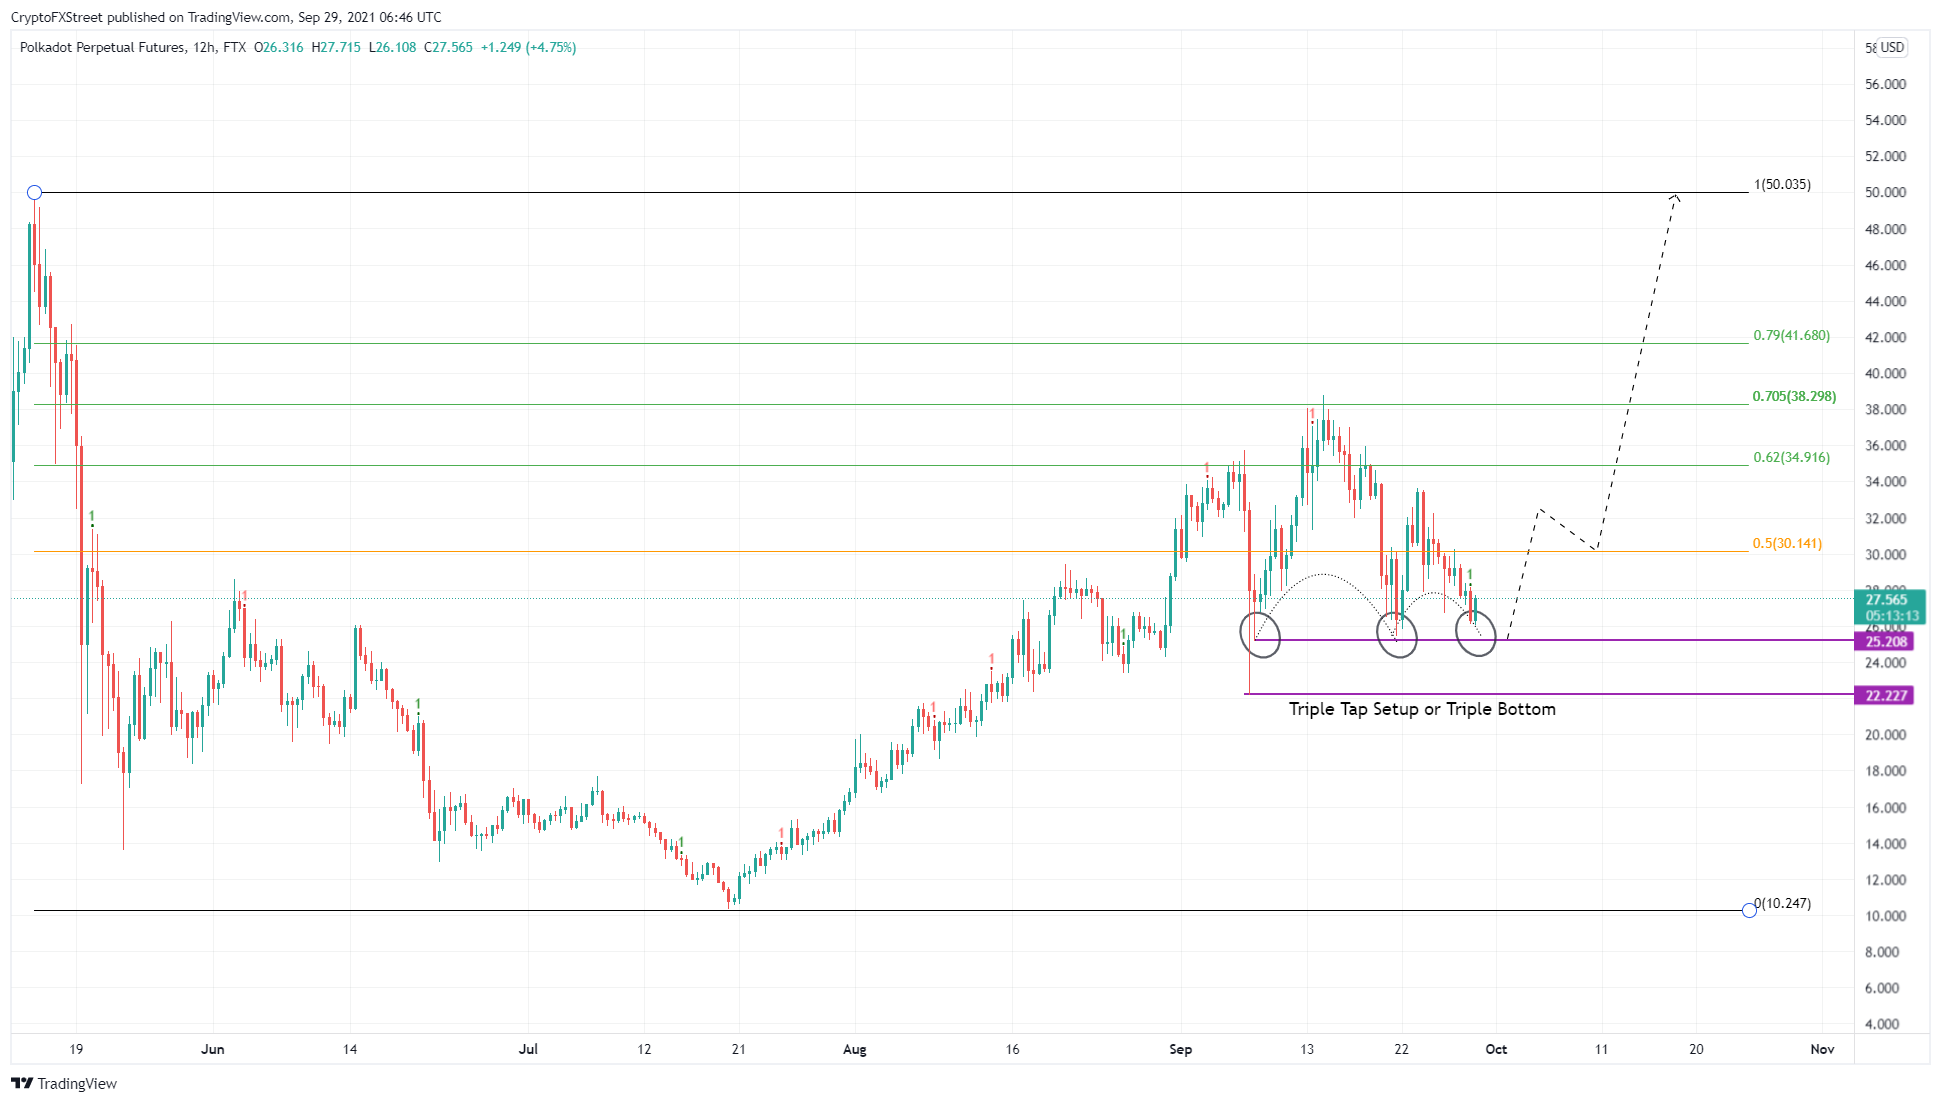
DOT/USDT 12-hour chart
While the MRI and the triple-tap setup play a pivotal role in forecasting a bullish outlook, the hidden bullish divergence seals the deal.
From August 26 to September 28, Polkadot price formed higher lows, suggesting a potential bullish trend in play. However, at the same time, the Relative Strength Index (RSI) created lower lows.
This forking between the price and the RSI is known as hidden bullish divergence. The result of such a technical formation often results in an uptrend. In DOT’s case, it strengthens the already optimistic narrative that the price is primed for a bull rally.
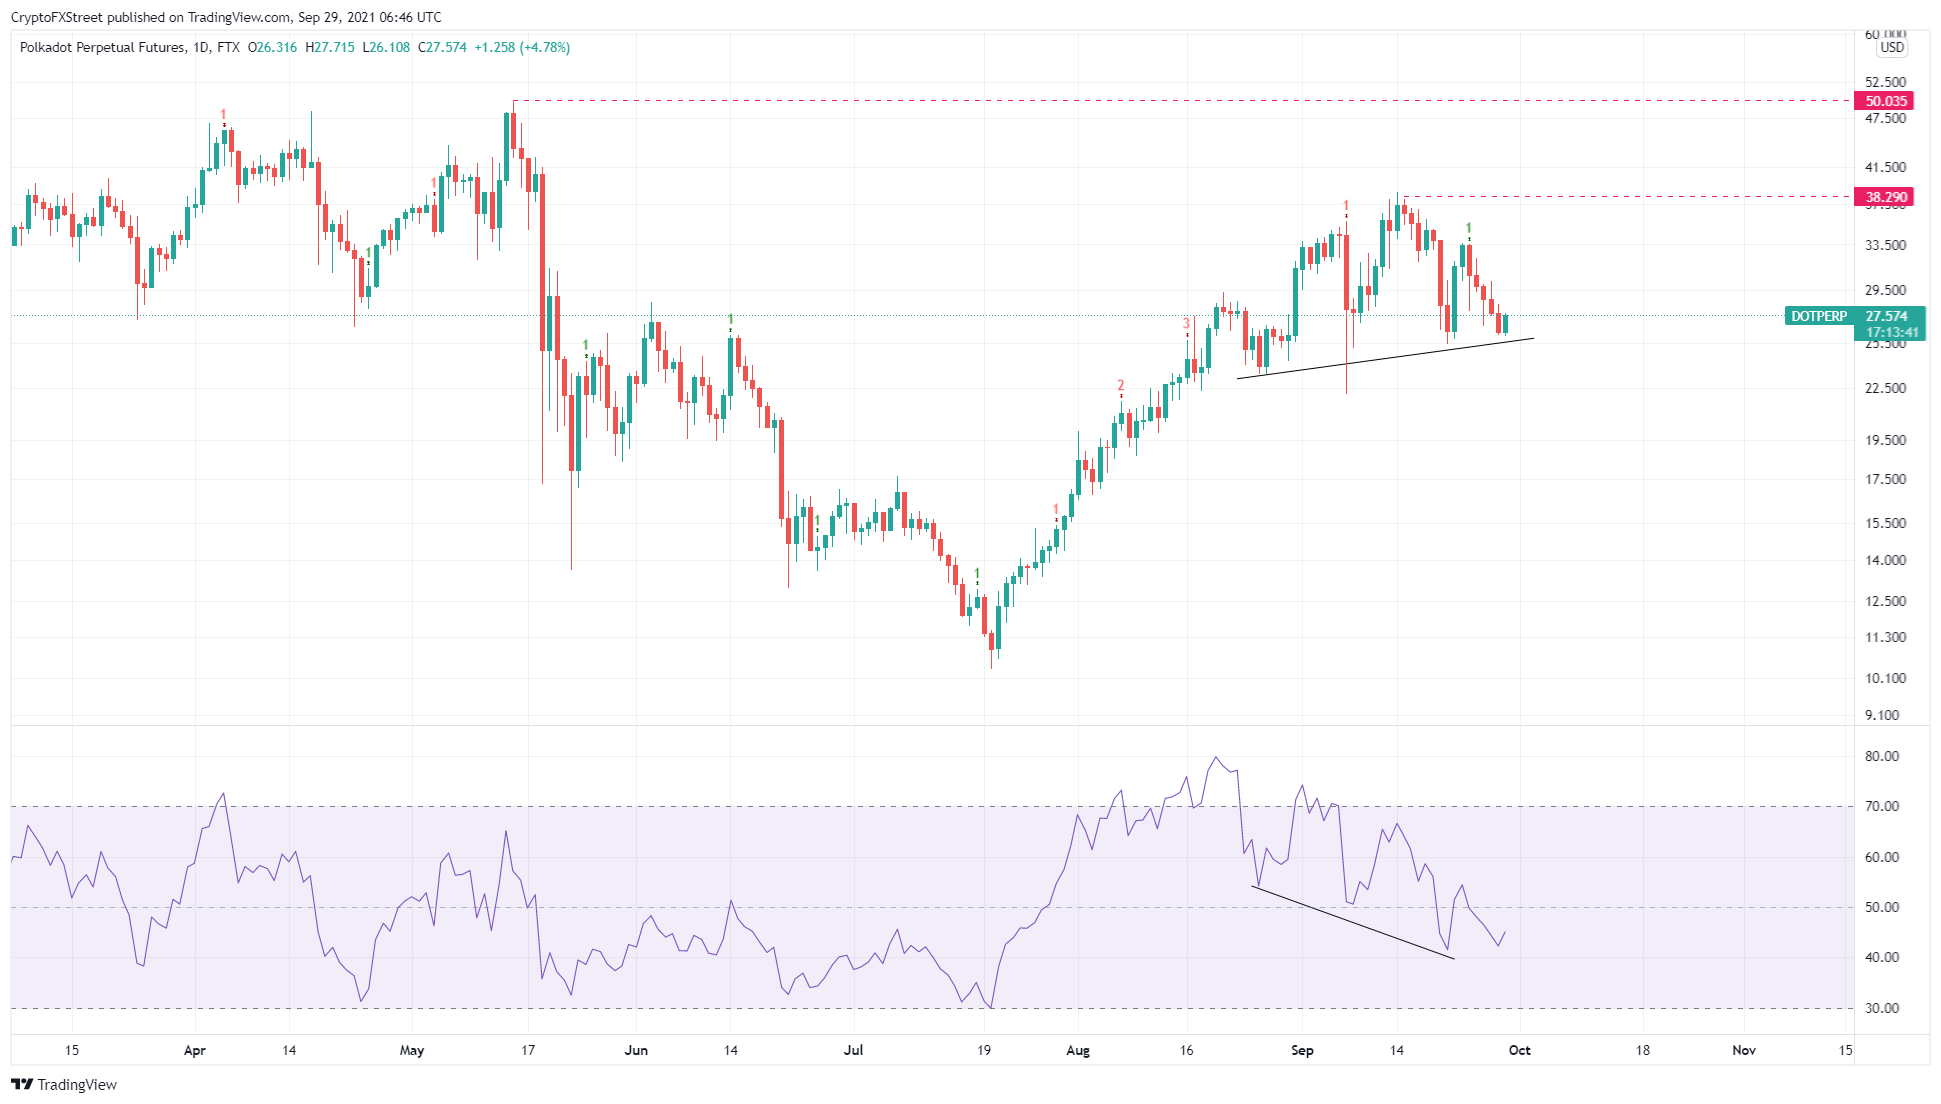
DOT/USDT 12-hour chart
Fundamentals support the bullish thesis
The last and the most crucial reason this optimism will find its way to push Polkadot price higher is the milestone achieved as a Financial Conduct Authority (FCA)-approved cryptocurrency custodian Digivault announced that it will custody DOT.
Digivault is the first stand-alone cryptocurrency custodian to receive a go-sign from the FCA. Since this custodian is seeing massive interest from retail investors and institutions, the recent development will encourage users to buy and hold DOT. In addition to Polkadot, the company offers custodial services for Bitcoin, Ethereum, USDC, ERC-20 and ERC-1400 products.
CEO of Digivault Rob Cooper added,
While the advanced nature of Polkadot makes the custodial integration more complex than other blockchains, we felt that it was essential to give people the ability to hold such a unique asset within a regulated custodian.
He also stated that their move to acquire a license for Polkadot custody was also a factor of interest from its customers, further adding a tailwind to DOT’s bullish thesis.
Author

Akash Girimath
FXStreet
Akash Girimath is a Mechanical Engineer interested in the chaos of the financial markets. Trying to make sense of this convoluted yet fascinating space, he switched his engineering job to become a crypto reporter and analyst.


