Polkadot price at make-or-break point as DOT awaits a range breakout
- Polkadot price spots a potential symmetric triangle pattern on the 1D chart.
- RSI stands neutral at 50.00, suggesting a lack of clear directional bias.
- 21-DMA offers immediate resistance, 50-DMA guards the downside.

Having faced rejection just shy of the $34 mark on a couple of occasions, Polkadot (DOT) bears are tightening their grip, as a fateful week draws to an end.
Polkadot price is set to book a second consecutive week of losses, as the crypto market sentiment remains undermined by the latest PBOC crackdown, a potential default story of China Evergrande property developer group and Fed’s tapering signal.
DOT price is shedding 1.75% on the day, currently trading at $30.33. Polkadot is down about 15% on a weekly basis.
Polkadot bears are testing the bullish commitments
On the daily chart, Polkadot price is traversing in a three-week-old symmetrical triangle formation, with DOT bulls having failed to find acceptance above the falling trendline resistance just below the $34.
Daily closing above the latter is critical to reverse the recent downturn, as it would validate a symmetrical triangle upside breakout, fuelling a fresh upswing towards the $40 threshold.
However, DOT buyers will first need to crack the immediate resistance aligned at the 21-Daily Moving Average (DMA) at $32.33 for any meaningful turnaround.
The 14-day Relative Strength Index (RSI) trades listlessly at the midline, suggesting that DOT price could yield a range breakout in either direction.
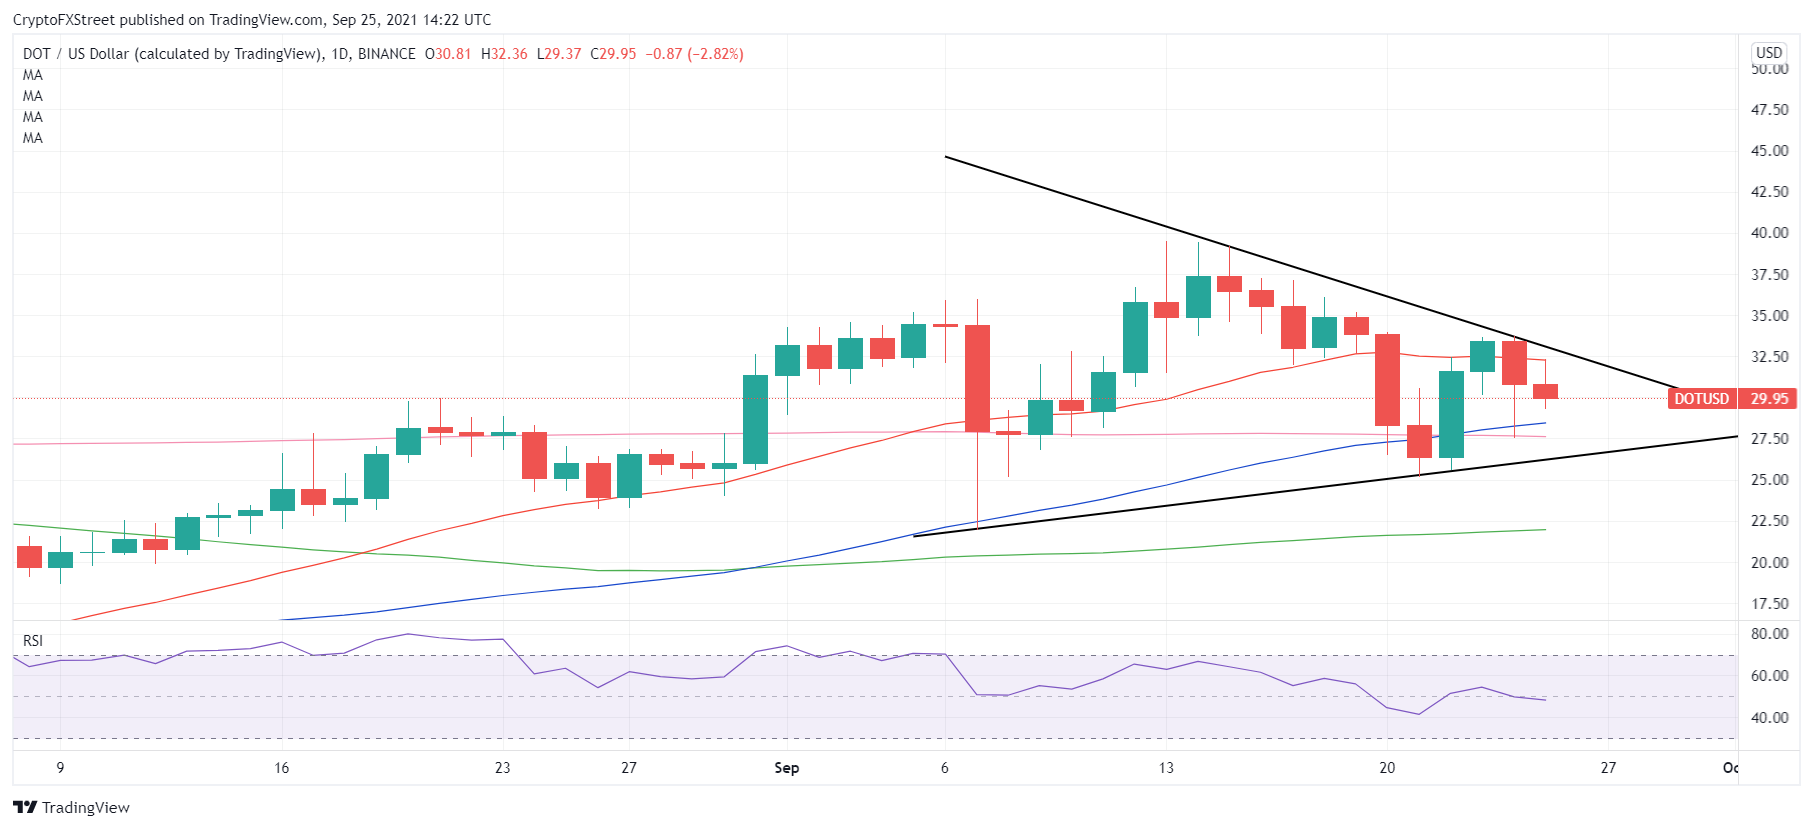
DOT/USD daily chart
If the 21-DMA barrier continues to guard the upside, then DOT price could extend the pullback towards the ascending 50-DMA at $28.38, which will offer an immediate cushion to DOT bulls.
Sellers would then aim for the horizontal 200-DMA support at $27.70. The last line of defense for DOT bulls is seen at the rising trendline (triangle) support at $26.33.
A sustained break below the latter would confirm a triangle breakdown, calling for a sharp drop towards the mildly bullish 100-DMA at $22.08.
Author

Dhwani Mehta
FXStreet
Residing in Mumbai (India), Dhwani is a Senior Analyst and Manager of the Asian session at FXStreet. She has over 10 years of experience in analyzing and covering the global financial markets, with specialization in Forex and commodities markets.


