Etheruem Price Prediction: ETH hangs by a thread as on-chain metrics hint at bearish onslaught
- Ethereum price tried breaching the upper trend line of a supply zone at $2,889 but failed.
- As long as ETH stays above $2,689, the upswing narrative will not be in jeopardy.
- On-chain metrics indicate that a potential drop should not come as a surprise.

Ethereum price rally is currently facing a blockade that could make or break its advance. While the technicals indicate that an upswing is plausible, on-chain metrics paint a rather somber picture for ETH.
Ethereum price at crossroads
Ethereum price was on a tear as it entered the supply zone extending from $2,689 to $2,889 with the goal of breaching it. However, Elon Musk’s timely tweet has kept this from occurring. Despite a 6% drop, ETH has managed to stay inside this resistance area.
A decisive 4-hour candlestick close above $2,889 will reignite the bullish momentum and confirm the start of a new uptrend.
If this were to happen, ETH could rally 11% to tag the immediate supply level at $3,117. Following this, Ethereum price could rise 10% to pre-crash levels at $3,442.
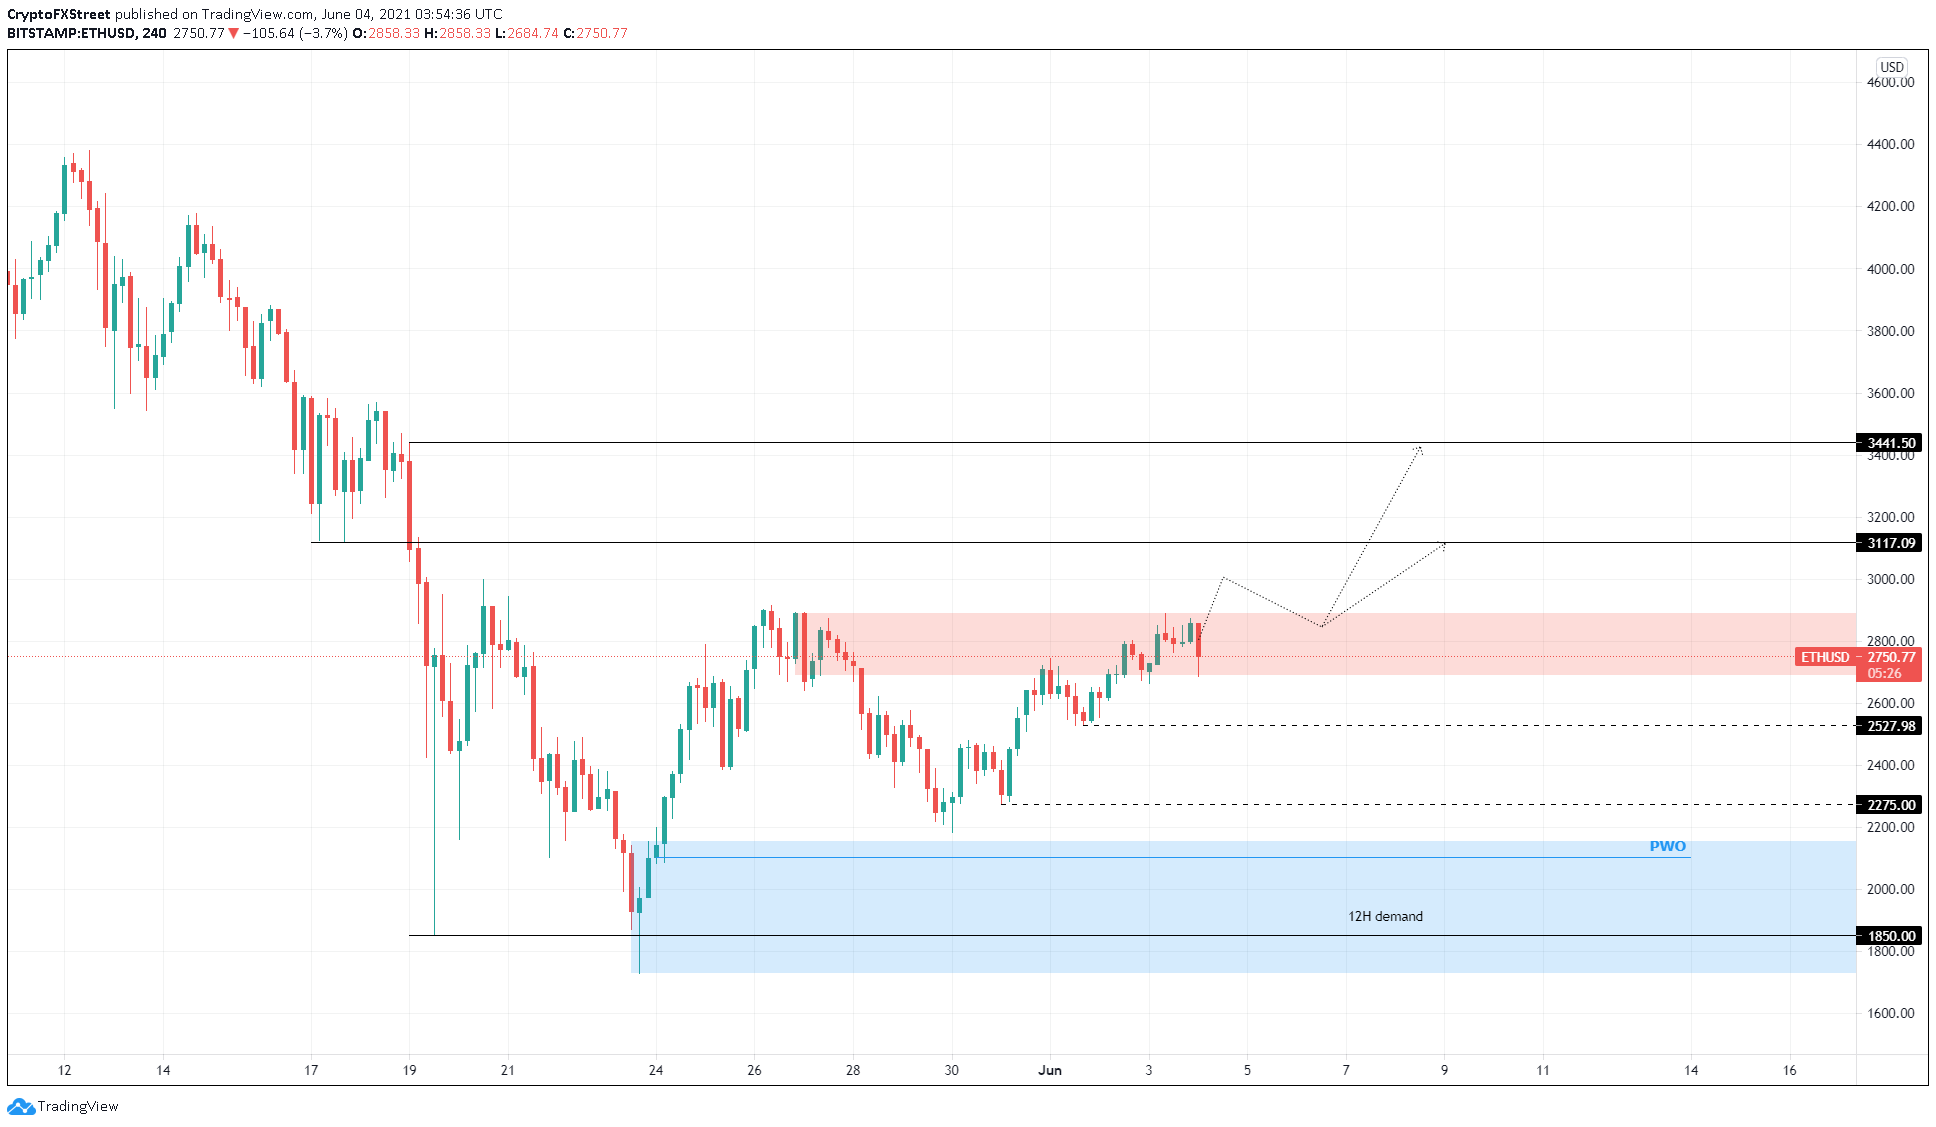
ETH/USD 4-hour chart
Supporting the bullish outlook is the supply of ETH held on exchanges, which has decreased from 21.98 million to 21.61 million ETH since May 25. This 1.6% decline suggests that some of the inventors are optimistic about the short-term performance of Ethereum price.
However, the same metric shows a 300,000 ETH increase over the past month, indicating that the overall trend for Ether held on centralized exchanges is increasing, which is a bearish development.
Therefore, market participants should exercise caution due to conflicting views.
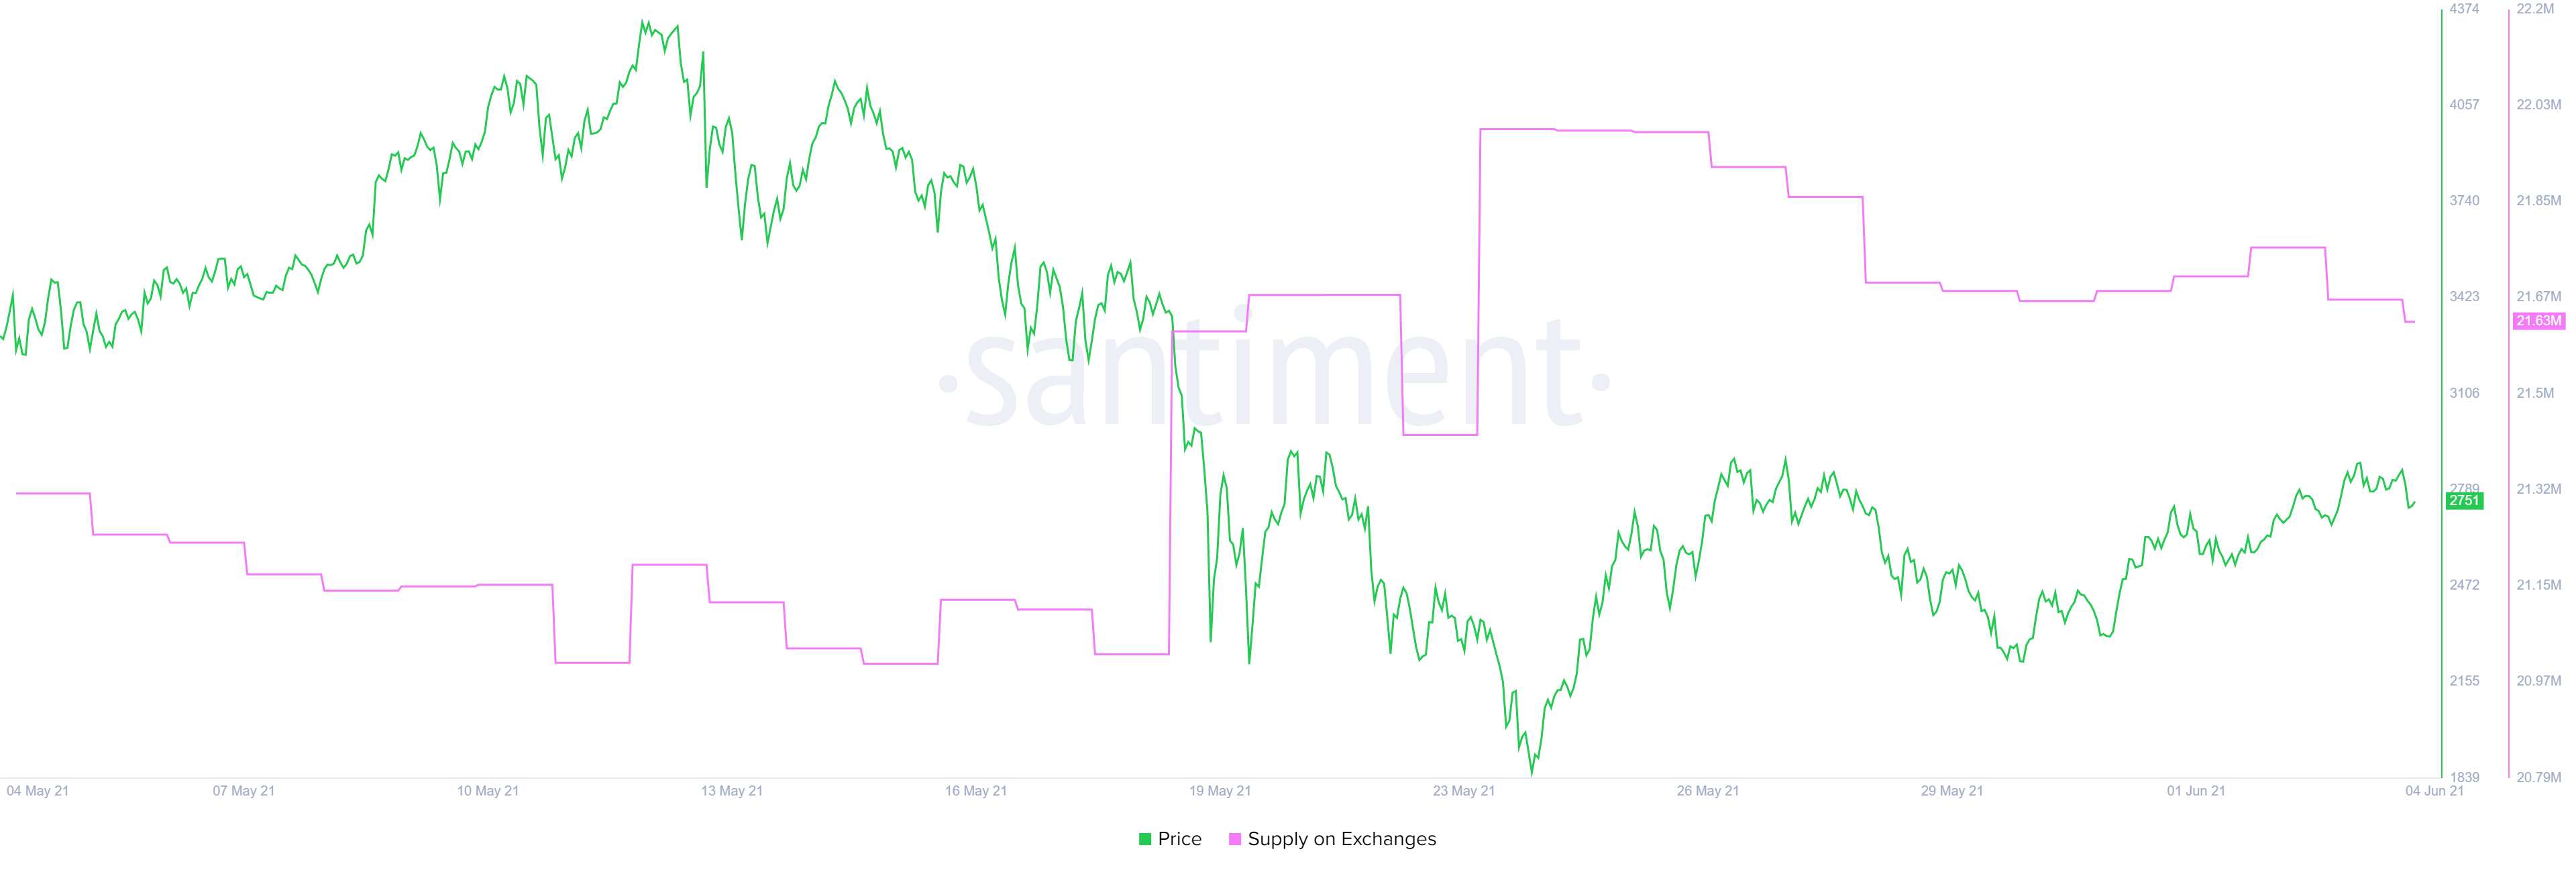
ETH held on exchanges chart
Adding to holders’ woes is the 365-day Market Value to Realized Value (MVRV) model, revealing that ETH has more room to head lower.
This fundamental index is used to gauge the profit/loss of users who purchased Ether in the past year. Currently, the 365-day MVRV is hovering around 57% after crashing from 158% on May 11.
Since a large percentage of investors remain in profit, there is a high chance these participants might book profits and add to the selling pressure, pushing Ethereum price lower.
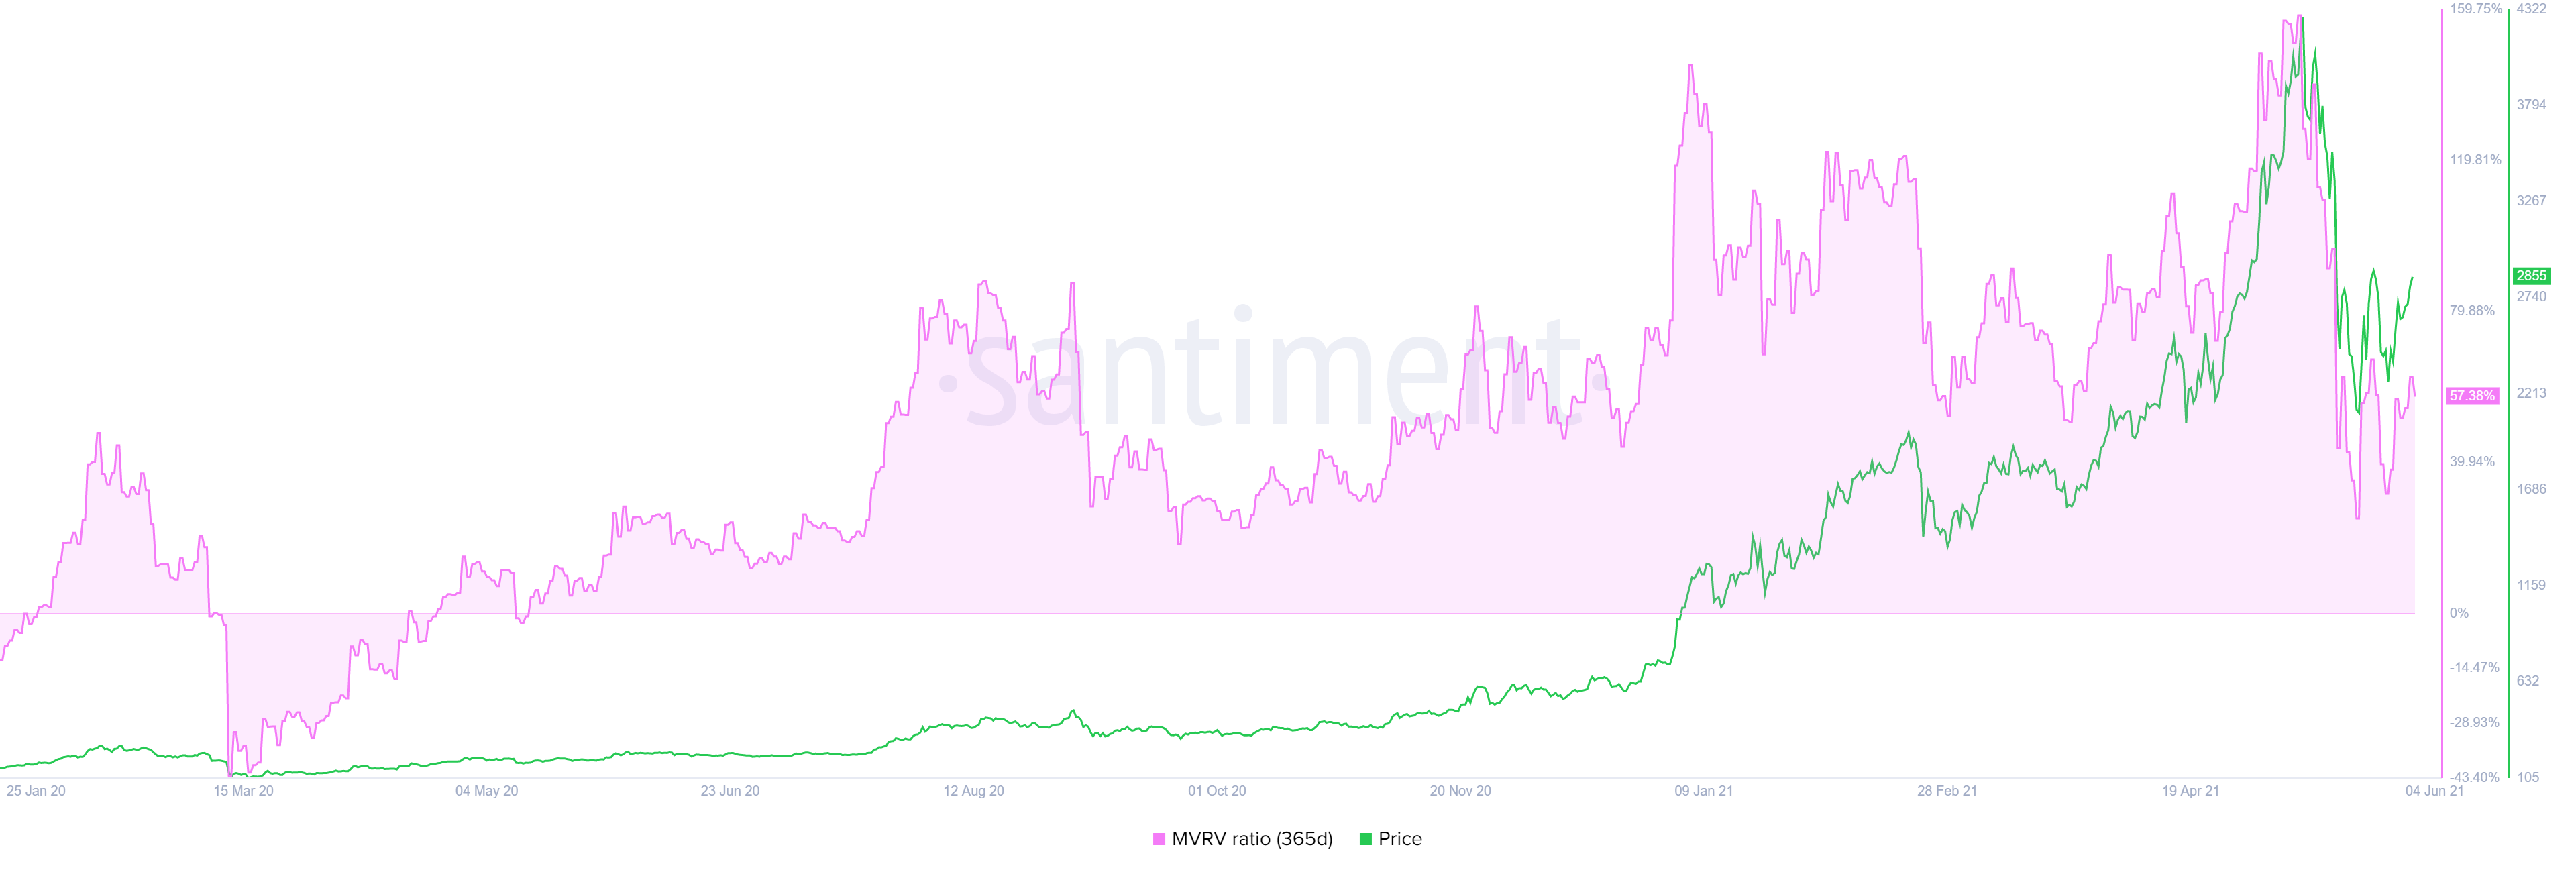
ETH 365-day MVRV chart
While things seem to be going up for Ethereum price, investors should note that a failure to stay inside the supply zone’s lower boundary at $2,689 will signal the inability of the buyers.
A convincing close below the June 1 swing low at $2,528 will invalidate the bullish scenario.
Such a move might trigger a 10% downswing to $2,275, which is the swing low created on May 31.
Author

Akash Girimath
FXStreet
Akash Girimath is a Mechanical Engineer interested in the chaos of the financial markets. Trying to make sense of this convoluted yet fascinating space, he switched his engineering job to become a crypto reporter and analyst.


