Ethereum strengthens its deflationary status after the Merge, ETH price slides
- Ethereum price's bottom remains elusive amid growing risks of another dip to $1,142.
- Ethereum has, for the first time since the Merge, become deflationary.
- Bears hold the fort, forcing ETH price to validate a symmetrical triangle breakout.

Ethereum price is on the way to reclaiming the ground it lost above $1,300. The pioneer smart contracts token tags support at $1,270 after being rejected from highs at $1,384 on Thursday. A four-hour to daily close above $1,300 is necessary to see ETH begin an up-trend. At the same time, this could circumvent the possibility of a drop to $1,142.
Ethereum becomes deflationary after the Merge
For the first time since the Merge software upgrade on September 15, Ethereum's supply has become deflationary. According to insights from ultrasound money, Ethereum's supply dropped to -0.12% over the last seven days. This development can be attributed to a recent spike in Ethereum's average gas fees, ranging between $20 and $30 gwei.
In the wake of the Merge – the transition from a proof-of-work consensus algorithm to a proof-of-stake mechanism saw the rate of newly minted ETH plunge by almost 90%. The drop was attributed to significantly reduced validator rewards compared to mining rewards.
With Ethereum burning a portion of the fees from processing transactions, the overall supply is going down – deflationary. This was expected as long the gas fees stayed above $15.3 gwei. In other words, there is more ETH being used up by burning than validators are getting. Subsequently, this situation results in fewer rewards for every succeeding block.
When a cryptocurrency hits its maximum set supply (put in place by an algorithm), its total supply halts. Now, assuming the same demand amid a constricted supply; prices tend to go up. This is what investors are hoping to see with Ethereum as its supply slows down with time.
Ethereum price foreshadows a 12% drop
The second-largest cryptocurrency finally confirmed a symmetrical triangle pattern breakout discussed on Sunday. Although symmetrical triangles do not have a bullish or bearish bias, traders can activate their short positions when the price slides below the lower trend line, as is the case with ETH price, shown on the chart below.
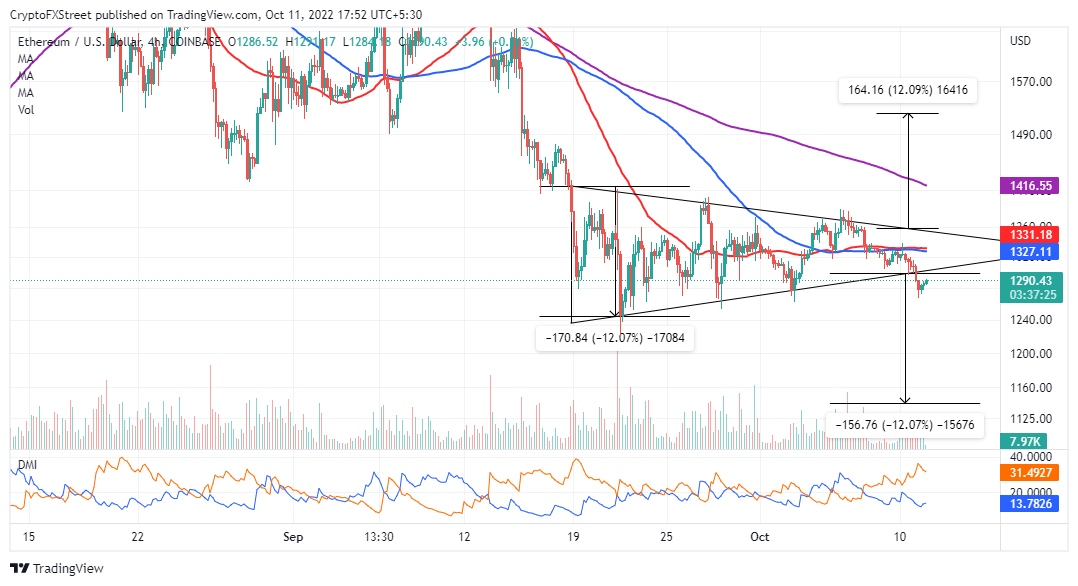
ETH/USD four-hour chart
A 12% breakout to $1,142 is anticipated, given the triangle breakout, if sellers heed the call to offload their bags. The DMI (Directional Movement Index) reinforces the bears' tightening grip. Overhead pressure will continue mounting on Ethereum price if the –DI keeps expanding the gap above the +DI.
-638010938494903097.png)
Ethereum IOMAP chart
Approximately 1.22 million addresses could hinder Ethereum price from settling above $1,300. These addresses hold 8.38 million ETH tokens purchased between $1,327 and $1,366. Investors selling at various breakeven points might dampen its uptrend, therefore, eventually culminating in a drop, as mentioned above, to $1,142.
Author

John Isige
FXStreet
John Isige is a seasoned cryptocurrency journalist and markets analyst committed to delivering high-quality, actionable insights tailored to traders, investors, and crypto enthusiasts. He enjoys deep dives into emerging Web3 tren


