Ethereum price ready for 5% correction before buy-the-dip playbook
- Ethereum price is in a consolidation phase around $3,267.
- Expect a break lower first in the breakout.
- Support comes in for Ethereum around $3,018.

Ethereum (ETH) is in a consolidation phase, with the symmetrical triangle being formed since September 7. Price action is getting squeezed in from both sides with lower highs and higher lows. With two tests on the upside of the symmetrical triangle, this acts as an element a little more in favor of the sellers and a break to the downside. These two additional entries have provided sellers some more opportunities to get short Ethereum, where buyers only had one chance to get in for a long. That was with just one test of the green ascending trend line.
Ethereum price will break lower for a 5% correction, with buyers ready to step in
The breakout lower will first face the monthly pivot at $3,122, but from the look of the chart of previous price action around this level, this will not be a big problem for sellers to push through. But once below the monthly pivot, some more headwinds might be just around the corner from there.
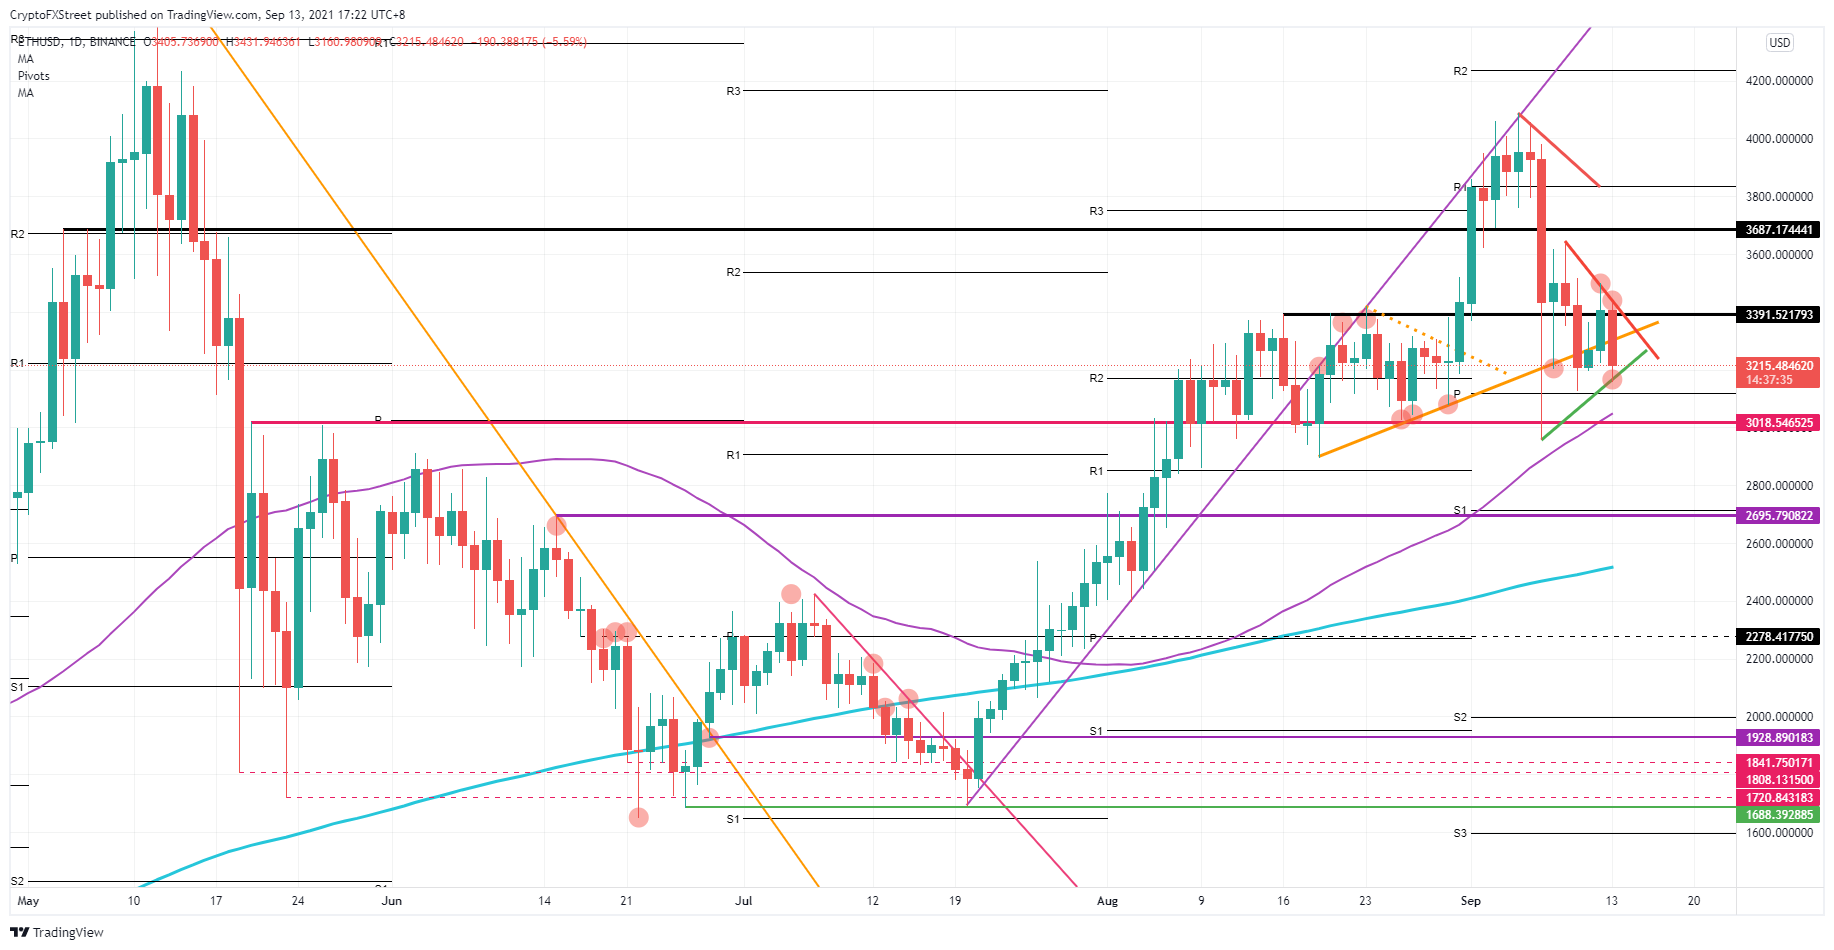
ETH/USD daily chart
At $3,018, a critical level comes in, originating from May 20. Granted, this level was chopped up a little bit at the beginning of August. But it will still hold quite some importance as it could control the body of the candles each time above its level. Ethereum sellers will have this level marked up as profit-taking. Buyers will try to take over here and ensure that Ethereum does not lose too much of its value – a perfect buy-the-dip play. Add to that the 55-day Simple Moving Average (SMA) at $3,020. It is a very attractive level.
If sellers are so forceful that they can wash out buyers from an attempt to go long, expect further downside with a potential 10% correction from $3,018. That would take Ethereum to $2,695. That level (purple line) is just below the monthly S1 support level, which makes it a double bottom and floor to be reckoned with. If buyers do not buy the dip at $3,018, they certainly will at $2,695.
Author

Filip Lagaart
FXStreet
Filip Lagaart is a former sales/trader with over 15 years of financial markets expertise under its belt.



