|

Ethereum Price Prediction: ETH presents buy signal, targeting $2,500

  • Ethereum price was held by the $2,000 support level after a steep correction.
  • As long as this demand barrier holds, ETH could rebound to $2,500.
  • The Tom DeMark Sequential indicator adds credence to the bullish outlook.

Ethereum price seems primed for a bullish impulse after a particular technical indicator presented a buy signal on the 12-hour chart. 

Ethereum price poised to rebound

Ethereum price has been in a downtrend since the beginning of June, shedding nearly 30% in market value. The second-largest cryptocurrency by market capitalization dropped from a high of $2,900 to recently hit a low of $2,040. 

Despite the significant losses incurred over the past three weeks, Ethereum price looks primed to rebound. The Tom DeMark (TD) Sequential indicator presented a buy signal on the 12-hour chart after ETH tested the 78.6% Fibonacci retracement level. 

The bullish formation developed in the form of a green nine candlestick, which is indicative of a one to four 12-hour candlestick upswing. A spike in buying pressure around the current price levels could see Ethereum price rise toward the 61.8% Fibonacci retracement level at $2,540. 
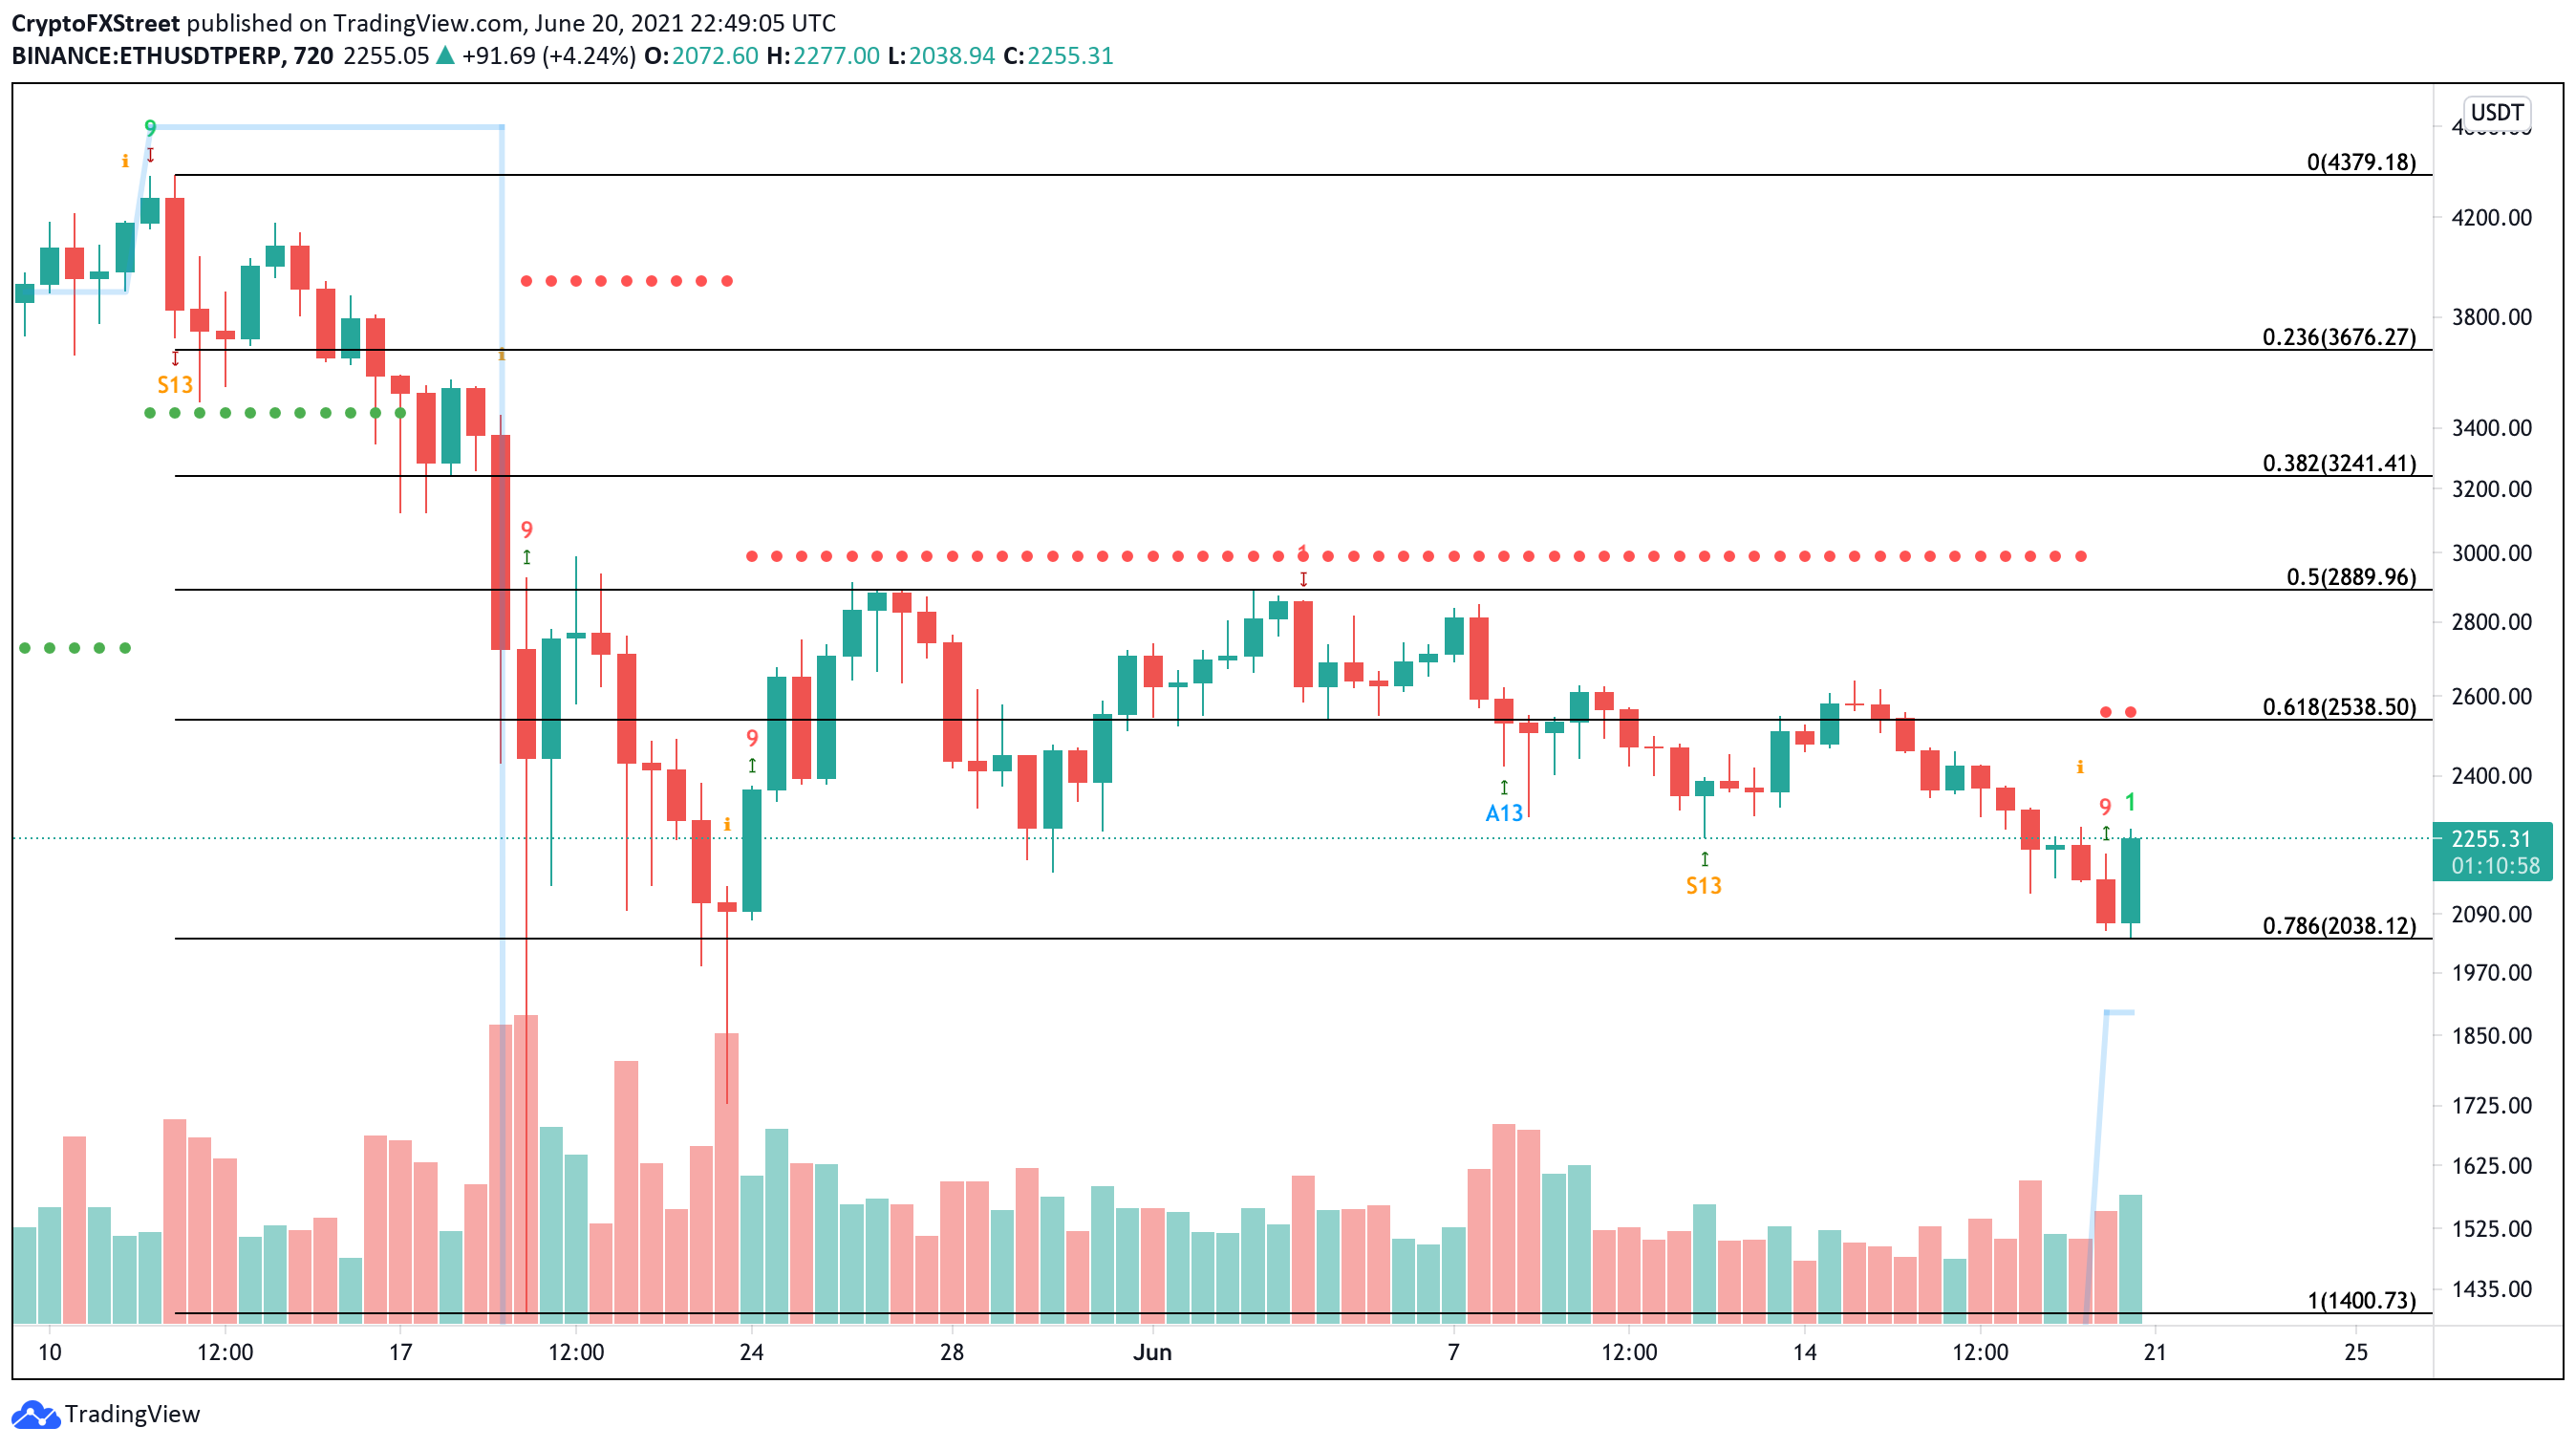
ETH/USDt 12-hour chart

ETH/USDt 12-hour chart

Even though the odds seem to favor the bulls, Ethereum price must remain trading above $2,040 to validate the bullish outlook. Failing to hold above this critical support level might spell trouble for the bulls. 

A 12-hour candlestick close below the $2,040 support may result in a retest of May 23 or May 19’s low. These interest areas sit at $1,730 and $1,400, respectively. 

Author

FXStreet Team

Composed of a group of economic journalists and FX experts, the FXStreet content team produces and oversees all content published on FXStreet. It provides a purely journalistic approach to the Forex market.


More from FXStreet Team
Share:

Editor's Picks

Bitcoin Weekly Forecast: BTC retreats as macro headwinds grow
Bitcoin (BTC) remains under pressure, down over 4% this week and trading around $76,900 at the time of writing on Friday. Institutional demand shows signs of weakness as spot BTC Exchange Traded Funds (ETFs) are on track to end their three-week inflow streak, recording nearly $500 million in net outflows through Thursday.
XRP falls toward key support as macro uncertainty, weak momentum cap recovery
Ripple (XRP) falls below $1.33 on Friday, marking the third consecutive day of declines. The token continues to track the broader cryptocurrency market downturn, with investors closely monitoring heightened macroeconomic uncertainty ahead of the United States (US) Consumer Price Index (CPI) release and next week’s Federal Reserve (Fed) monetary policy decision.
Crypto Today: Bitcoin, Ethereum, XRP stabilize at lower levels amid ETF outflows and macroeconomic risks
The broader cryptocurrency market is rising on Friday, with Bitcoin (BTC) trading above $77,000 after testing lower support near $76,500. Ethereum (ETH) shows signs of stability, hovering above the support provided at $2,400 despite capped upside at $2,500. Meanwhile, Ripple (XRP) holds above $1.33 after three straight days of declines, reflecting growing headwinds due to macroeconomic uncertainty.
Bitcoin pulls back as another golden cross fails to deliver
Earlier this week, Bitcoin formed a golden cross, a technical signal that occurs when the price’s 50-day moving average rises above the 200-day moving average and is conventionally viewed as a precursor to a bullish rally. Historically, however, that’s often not been the case.
Bitcoin: BTC retreats as macro headwinds grow
Bitcoin (BTC) remains under pressure, down over 4% this week and trading around $76,900 at the time of writing on Friday. Institutional demand shows signs of weakness as spot BTC Exchange Traded Funds (ETFs) are on track to end their three-week inflow streak, recording nearly $500 million in net outflows through Thursday.

