Three reasons why Ethereum price might hit $3,500 in a few weeks
- Ethereum price has been coiling up for nearly a month, indicating a massive breakout move shortly.
- While the short-term scenario hints at a bearish descent, the mid-to-long-term outlook remains bullish.
- Two on-chain metrics suggest a potential upswing that could propel ETH to $3,500.

Ethereum price has been neutral and range-bound since the May 19 crash. Due to its consolidation, ETH and other altcoins appear to have developed a massive correlation with BTC. Such an increase in correlation indicates that investors are relying on the flagship cryptocurrency to perform and are hesitant about the rest.
While it does paint a bearish picture, it is ephemeral. Once the consolidation ends, Ethereum price will likely outperform BTC as it did in the recent bull run.
Ethereum price eyes 60% bull rally
Ethereum price set up a demand zone as it rallied nearly 15% from $2,524 to $2,890 between June 1 and June 3. However, this support area was soon invalidated as sellers pushed ETH below it on June 8, converting it into a supply zone.
The recent attempt to breach past this resistance barrier failed as the Momentum Reversal Indicator (MRI) flashed a sell signal in the form of a red ‘one’ candlestick. This technical setup projects a one-to-four candlestick correction, suggesting that ETH is primed for a downtrend.
Therefore, if the selling activity continues, Ethereum price could revisit the 50% Fibonacci retracement level at $2,230 or $2,178.
Such a move will provide the buyers a chance to recuperate and come back stronger. The last time ETH tagged $2,178, it surged 32%. However, this time around, investors can expect a 60% bull rally to $3,500.
For this to happen, Ethereum price needs to successfully produce a decisive 4-hour candlestick close above the supply zone’s upper boundary at $2,668. Doing so will allow the smart contract token to rise toward the range high at $2,914 and then test the supply zone that extends from $3,438 to $3,569.
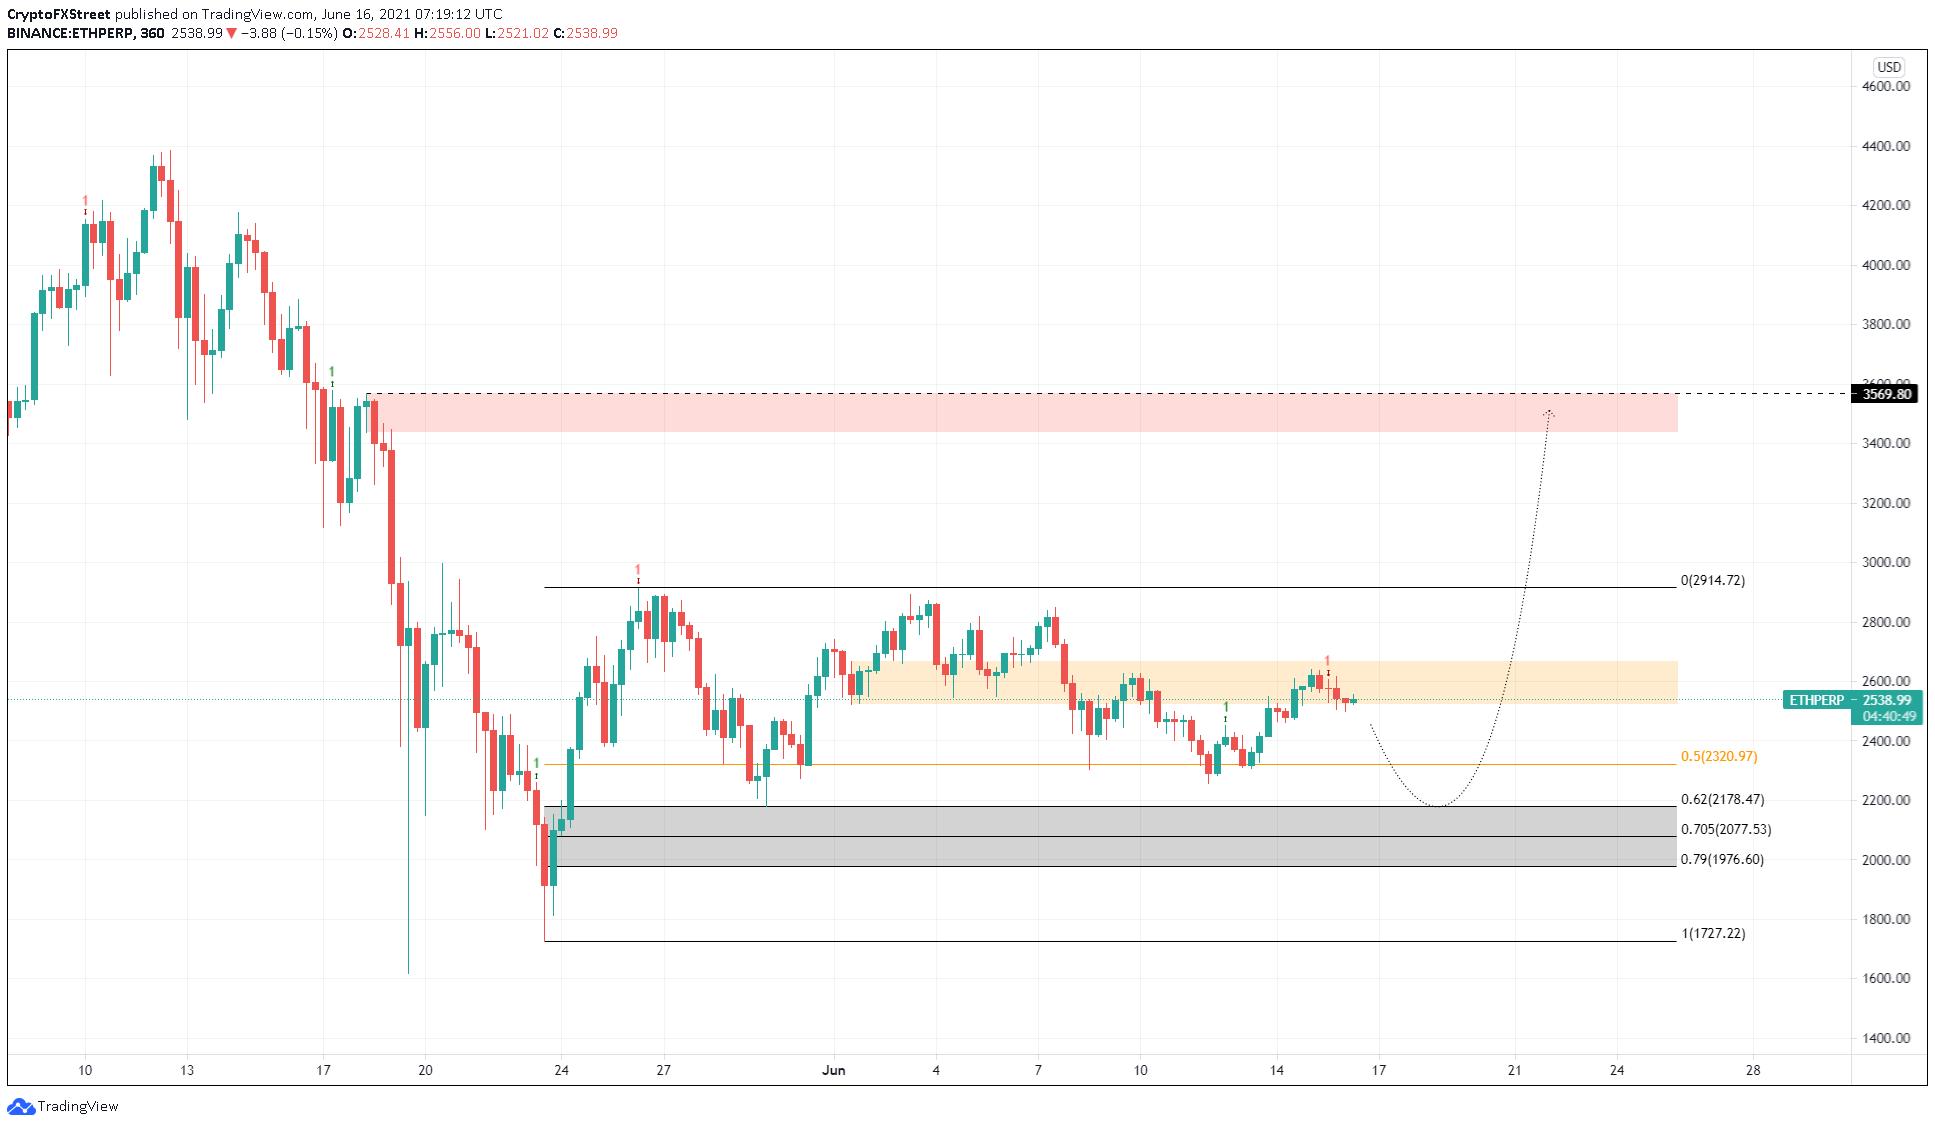
ETH/USDT 6-hour chart
The reason why Ethereum price might witness a potential spike in buying pressure is in the ETH-BTC correlation chart. As seen below, over the past six months, ETH has experienced cycles where it gets highly correlated to BTC and then shatters this relationship.
From January 21 to February 2, the correlation dropped by 108% to -0.08 while ETH price rose by 33% from $1,200 to $1,600.
Similar drops in correlation were observed three times over the past six months, with the most significant decline seen between April 20 to May 15, during which time Ethereum price rallied by 60% from $2,500 to $4,000.
At the time of writing, the correlation to BTC is hovering around 0.77, sloping to the downside. Therefore, if a similar drop were to occur, Ethereum price will surely see a massive spike in buying pressure that would push ETH to outperform BTC.
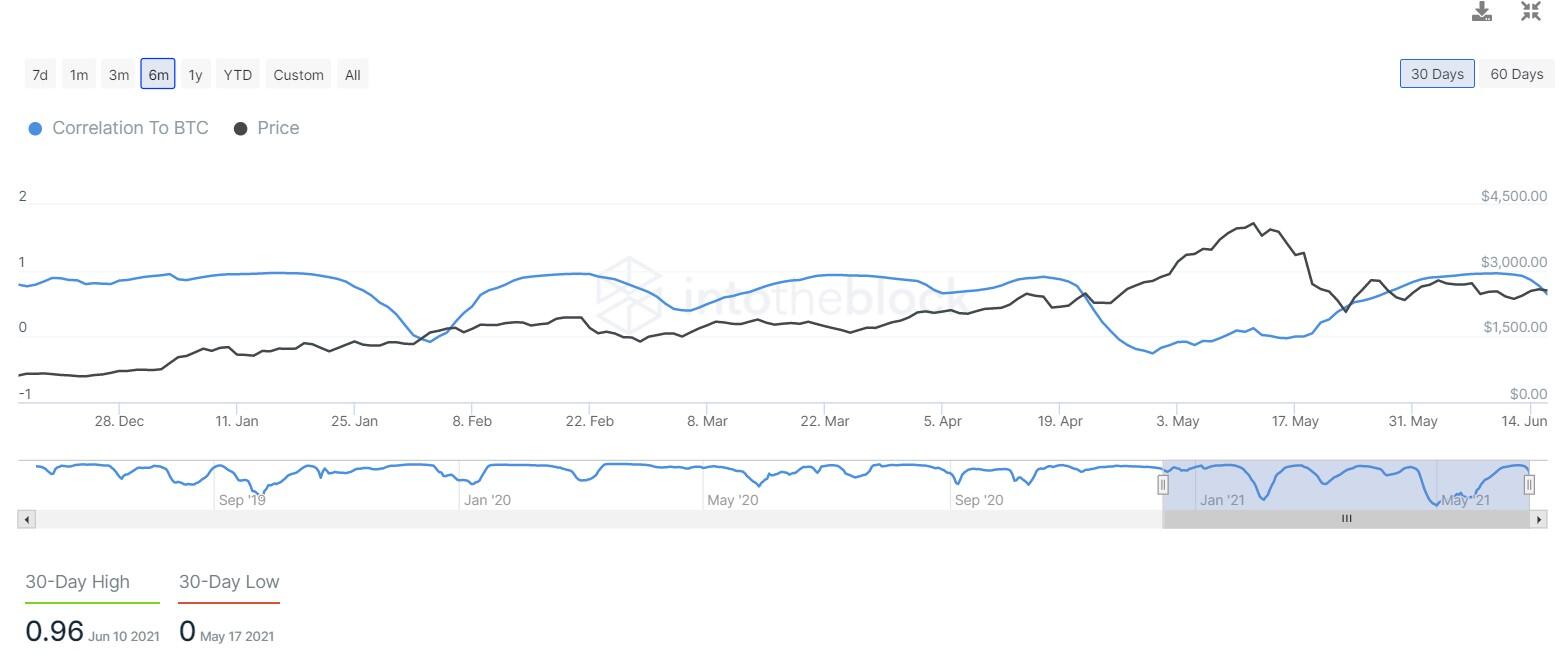
ETH correlation to BTC chart
Further adding credence to this bullish outlook is the average fees on the Ethereum blockchain, which has dropped from $55.62 on April 19 to $2.94 today. As a result, investors who were less inclined to participate in the DeFi summer due to high fees will now have the opportunity to explore.
Therefore, this 94% plummet in fees reveals that the network is less congested and hints that new capital will rotate into the ETH ecosystem, thereby pushing Ethereum price higher.
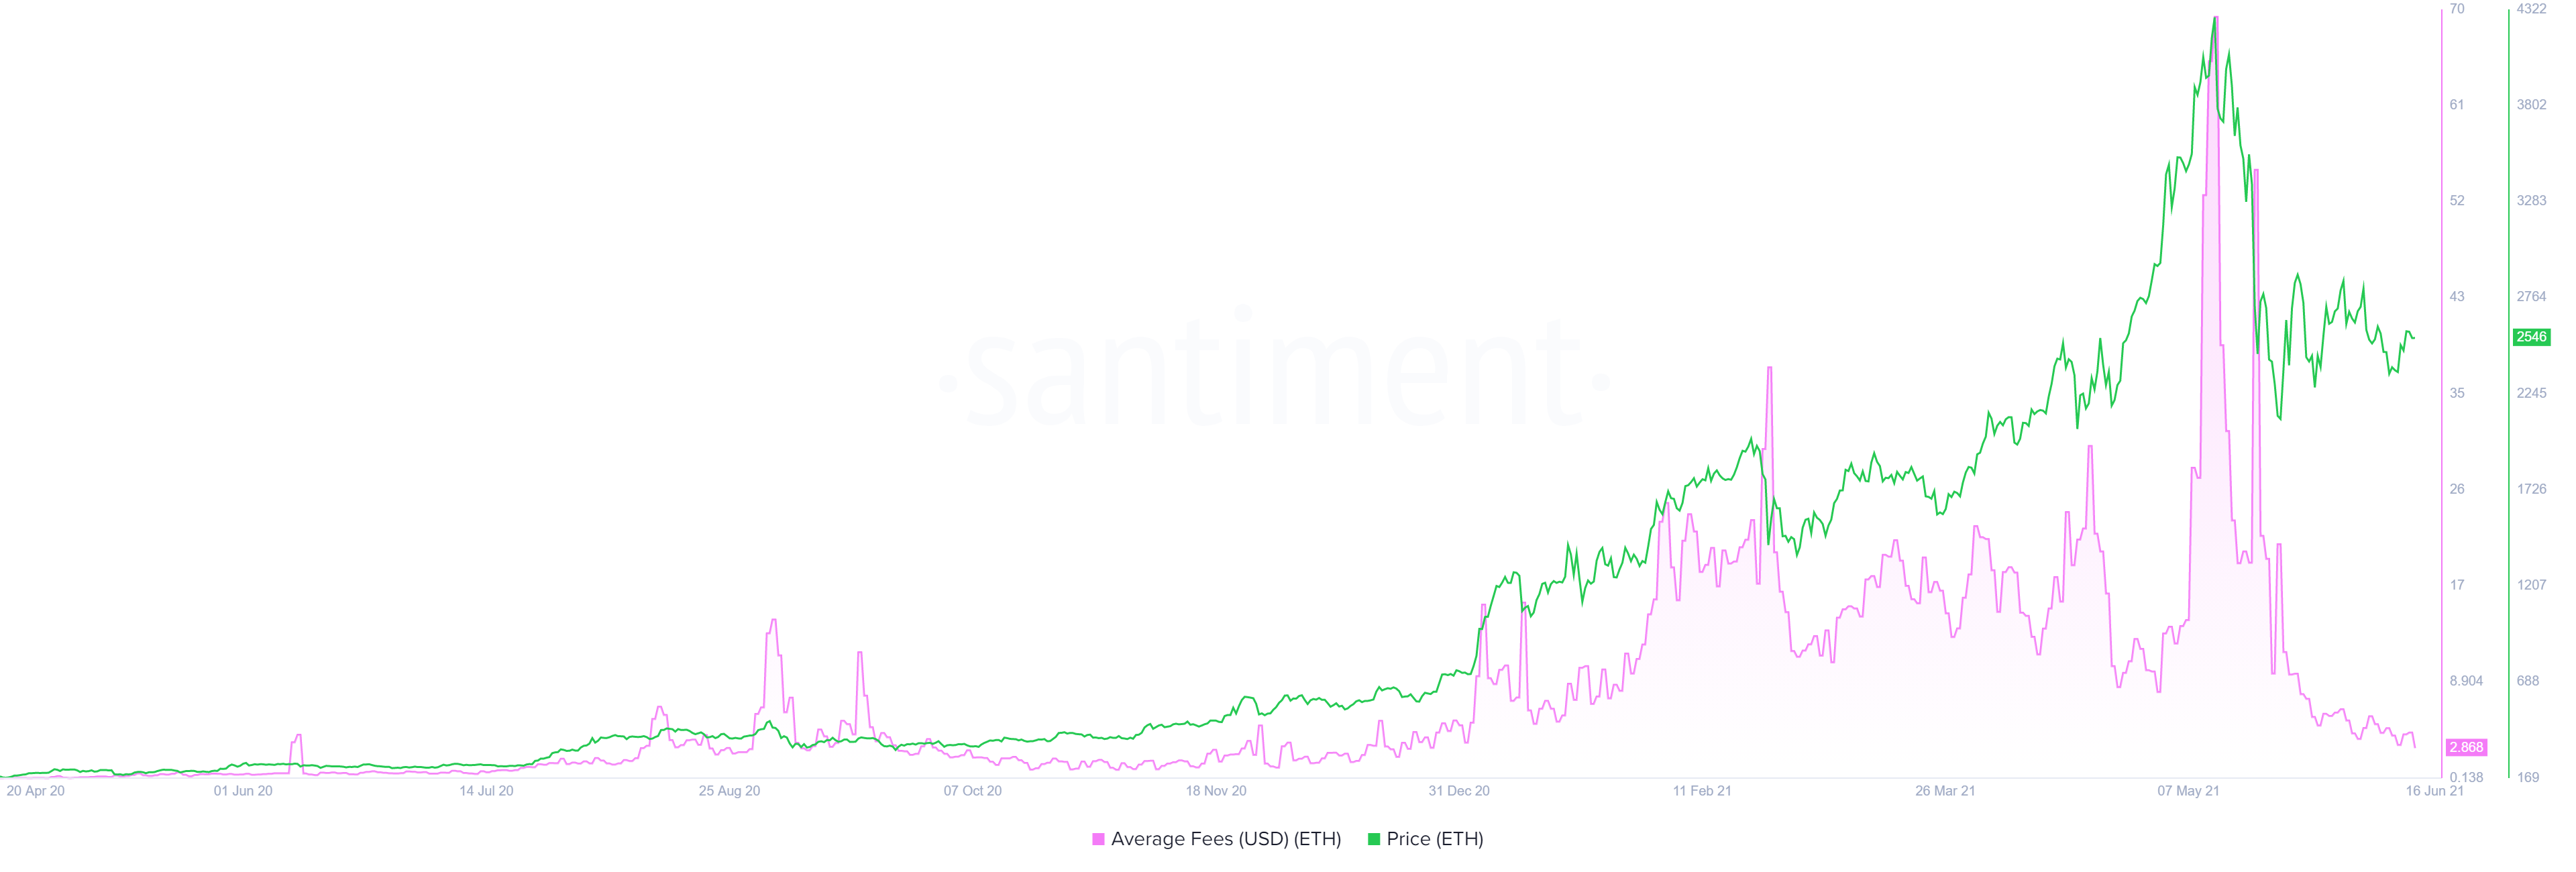
ETH average fees chart
Moreover, the Market Value to Realized Value Z-score for Bitcoin shows a potential bottom formation. Glassnode outlines that this fundamental index is used to assess when Bitcoin is over or undervalued relative to its "fair value."
During the 2021 bull run’s peak, MVRV Z-score hit 7, an overbought zone. Since then, this indicator has dropped 72% to 1.96. Such a drastic decline is quite similar to the one seen during the initial phase of the 2013 bull run.
If history were to repeat and a similar reversal occurs, investors can expect Ethereum price to continue its ascent. Such a move adds credence to the 60% bull rally thesis explained above and could be the start of the next leg up.
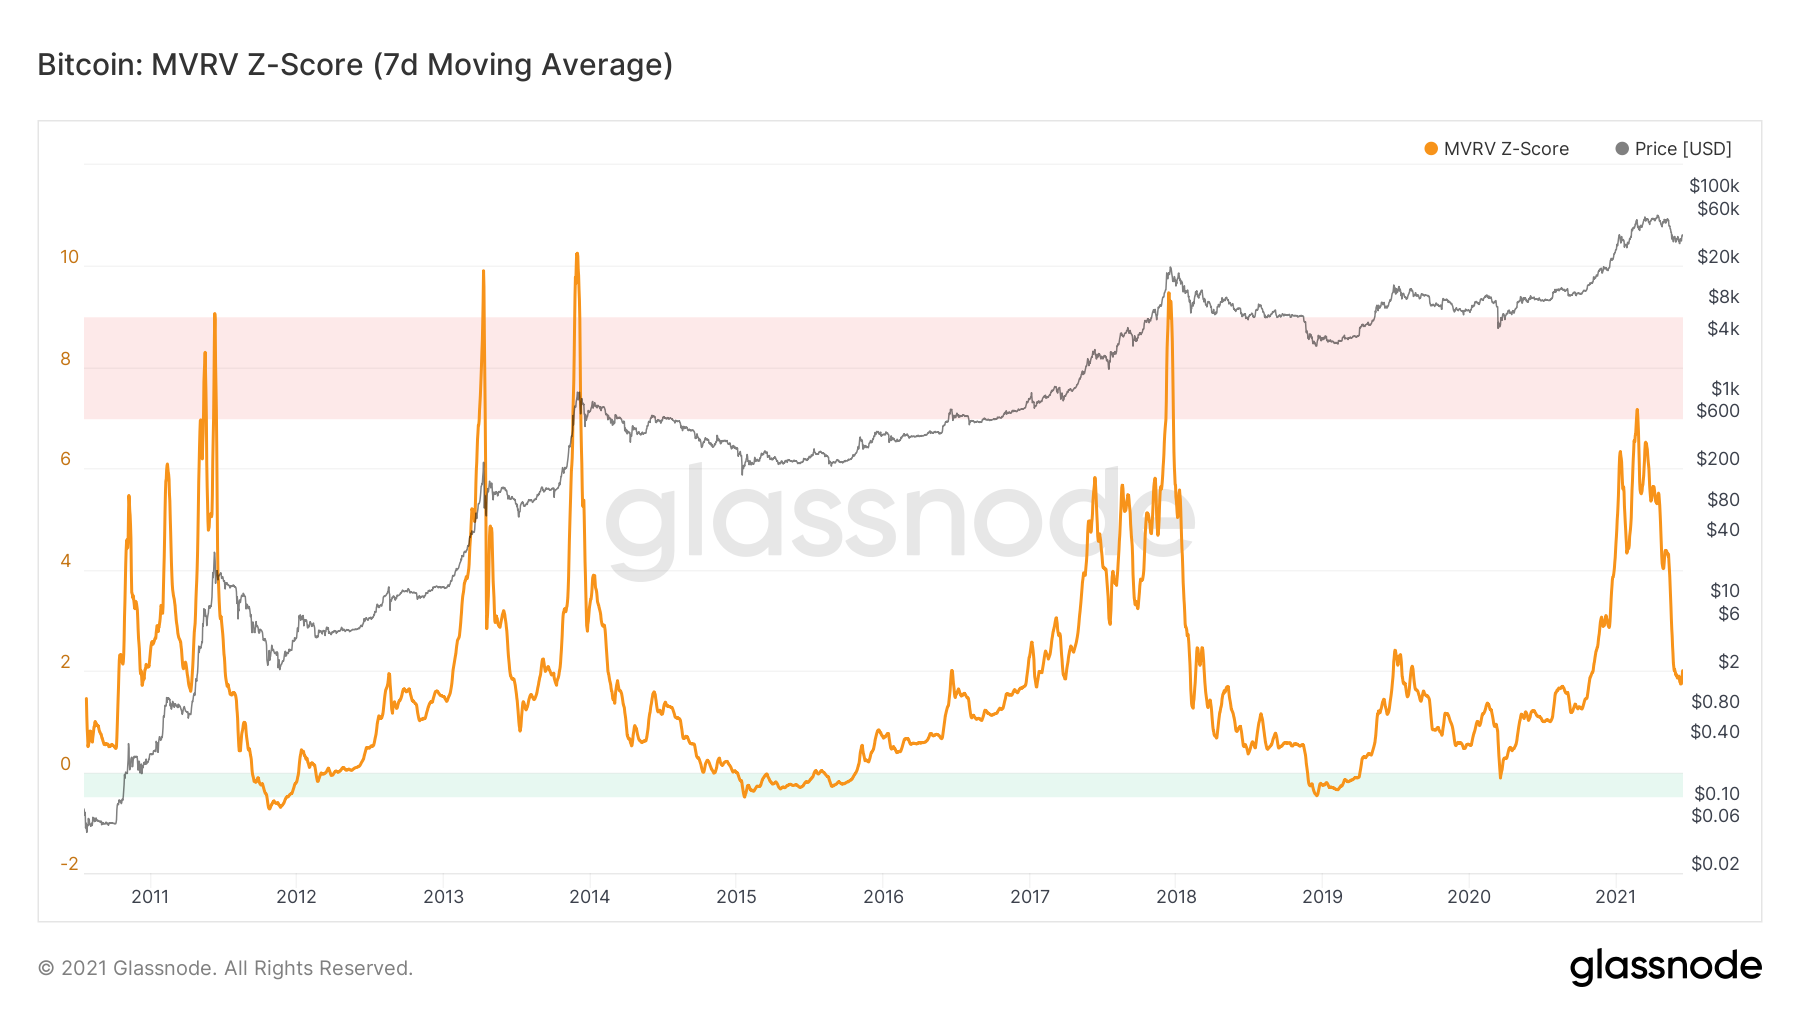
ETH MVRV Z-score chart
Lastly, the fundamentals of Ethereum are strong as ever, especially with the blockchain transitioning to ETH 2.0 via the London hardfork, which will bring the much-awaited EIP-1559 that will push Ethereum’s narrative as an investment asset higher.
From a macro perspective, all these events will help ETH break away from BTC’s grasp and make it an uncorrelated asset, at least in phases, that will allow Ether to outperform the flagship crypto, just as it did during the recent bull run.
Therefore, to sum it up, Ethereum price looks to head lower short-term, allowing it to recuperate and invite the sidelined investors to jump in. The rally that stems after this downtrend is most likely to slice through the resistance levels set up during the consolidation and head straight to $3,500.
If such a move were to occur, it would generate FOMO, attracting retail investors, push Ethereum price to all-time highs at $4,384 and, in a highly bullish case, to new highs.
However, if the buyers fail to jump on the bandwagon at $2,178, leading to a breakdown of the 79% Fibonacci retracement level at $1,976, it will trigger the threat of further decline. Therefore, this move does not invalidate the bullish thesis but only delays it.
Ethereum price might retest the May 19 lows at $1,619 before kick-starting the upswing in certain circumstances.
Author

Akash Girimath
FXStreet
Akash Girimath is a Mechanical Engineer interested in the chaos of the financial markets. Trying to make sense of this convoluted yet fascinating space, he switched his engineering job to become a crypto reporter and analyst.


